This is the multi-page printable view of this section. Click here to print.
Blog
Posts
Is There a Best Strategy For Roth Conversions?
There are multiple strategies for Roth conversions.
- Don’t roll. Take RMDs and hold with after tax.
- Roll now. Shift the balance today.
- Apply a dollar-cost averaging strategy.
- Countless other approaches.
We can model particular strategies and gain understanding of how they might work in situations that resemble our own. But we still can’t be confident that they would work in our particular case.
Let’s step back for a minute. What is the appeal of a Roth conversion? To reduce or eliminate taxes. Maybe the best strategy is the one that focuses on taxes.
Rollovers are taxed as ordinary income. But the rate they are taxed at depends also on IRA draws, other income, capital gains, and Social Security.
What drives all these tax inputs? It’s the spending. Given all your accounts and assets, if you want to spend $100K this year, you can pick those transactions that pull your $100K with a minimum tax bite. We start with spending.
We can model accounts, assets, and 25 years of spending, then pick the transactions that successfully cover each year of your spending or barring that, minimizes any shortfall.
Once you have your expenses covered, your focus will shift to the size of your estate.
My goal
I actually have two goals.
- Spend what I want.
- Die with the most money.
The best Roth conversion strategy will be the one that best meets my goal. Impossible to know in advance, it will fall out, as a side-effect of this exploration.
Hedgematic for IPhone
I will use Hedgematic to explore my approach.
Hedgematic starts with birthday(s), retirement and after-tax account balances, Social Security status, health, and yearly current-dollar, after-tax income requirements, then constructs a stream of transactions to realize a yearly paycheck, including estimated taxes, for the duration of retirement. Each year is hedged separately with a combination of S&P and TIPS inflation protected bonds; Shiller’s CAPE10 is used to tune proportions for each maturity.
My Portfolio
I have a $1M IRA and an empty Roth account. I maxed out Social Security; my spouse stayed home. We’re both 67, and have chosen to take Social Security at full retirement age. We figure we’ll outlive 80% of our high school class. I want to know if I can I count on $100K/year of current-dollar after-tax income. I plug the numbers into Hedgematic and compute my portfolio.
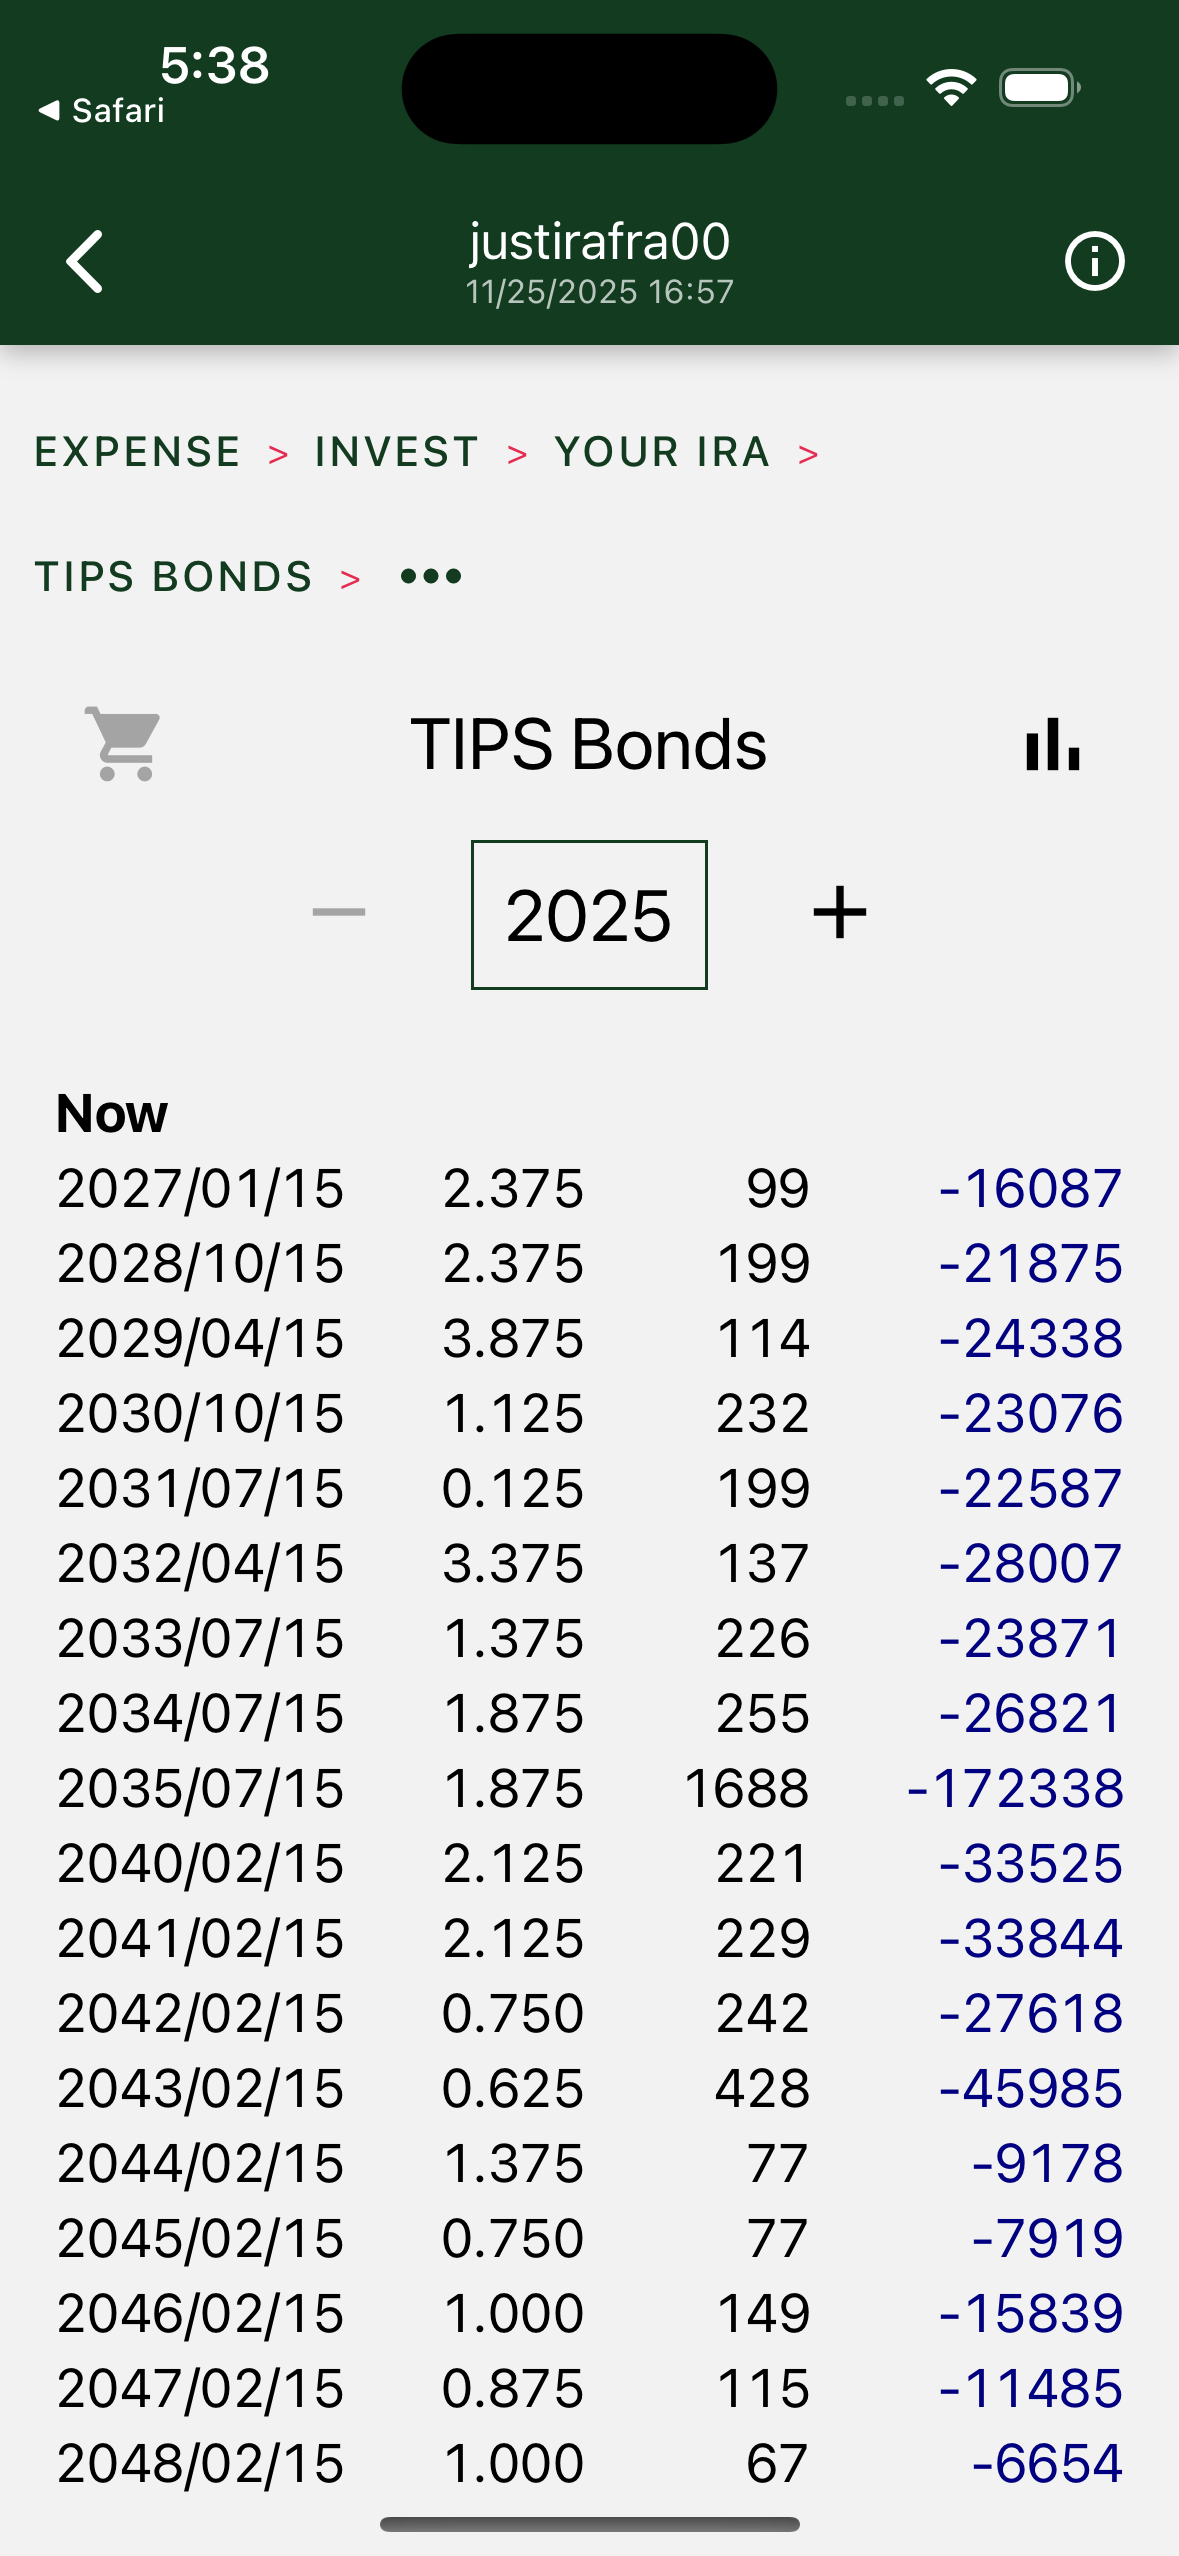
The portfolio is literally just a list of transactions for each account for each year. Shown here are my day zero TIPS transactions. I purchase a ladder of bonds to provide current dollar payments into the future. Elsewhere, I am instructed to buy S&P.
IRA Balance to Zero
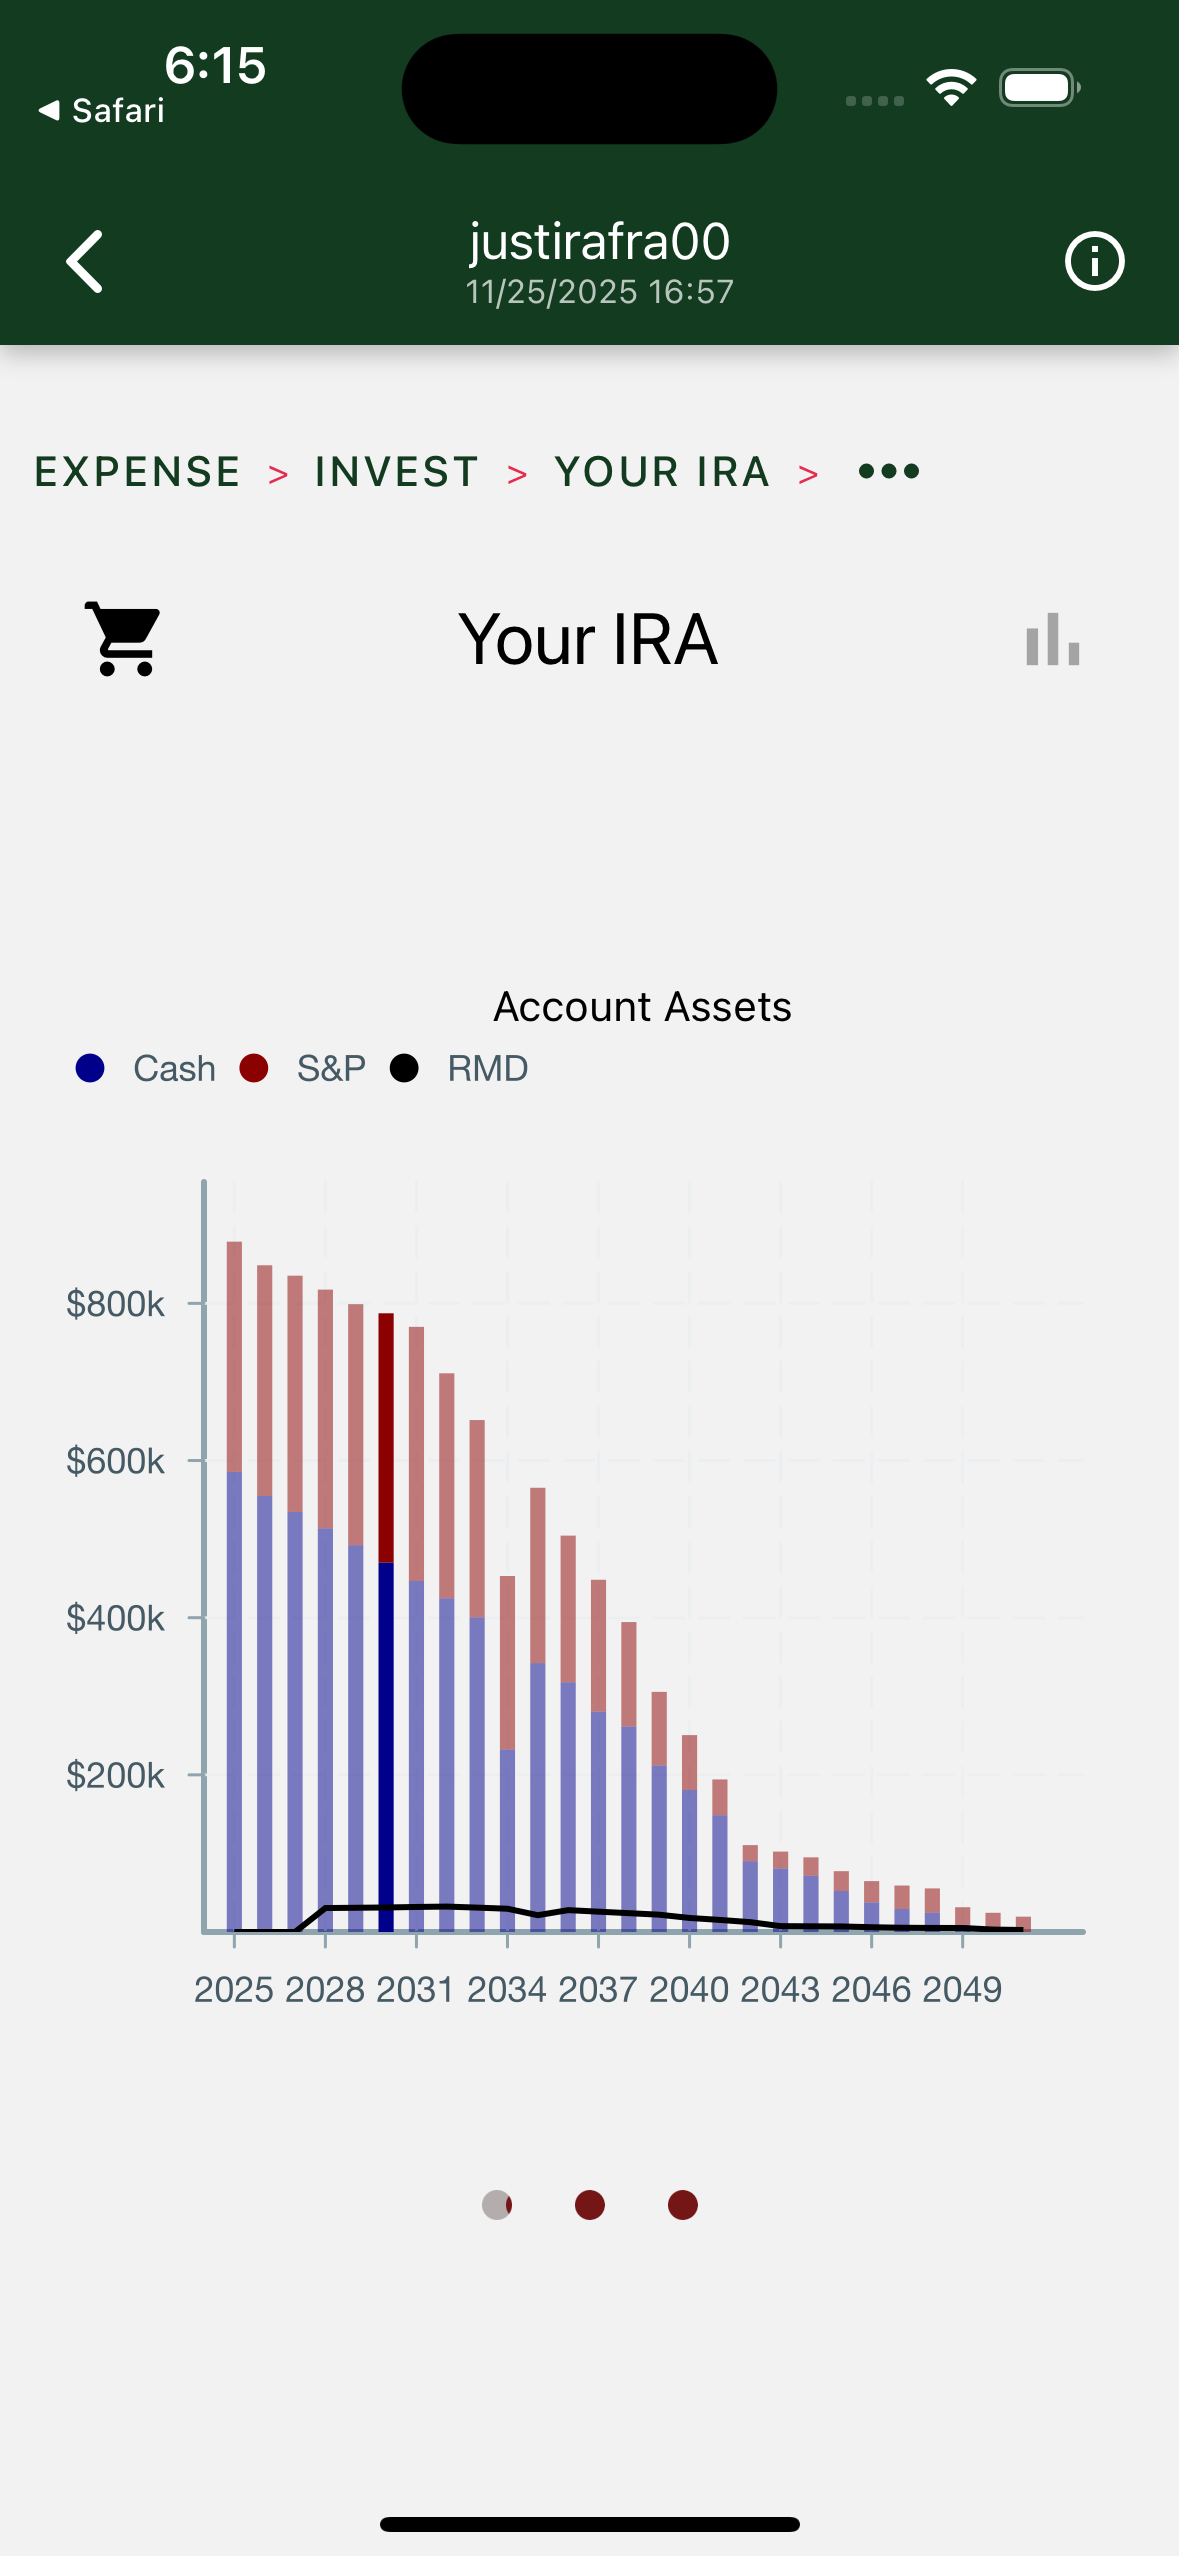
The recommended strategy drains the IRA, but not all at once.
TIPS are blue. Stock is red. The IRA has been drained. Contents have all either been spent, or sent to the Roth.
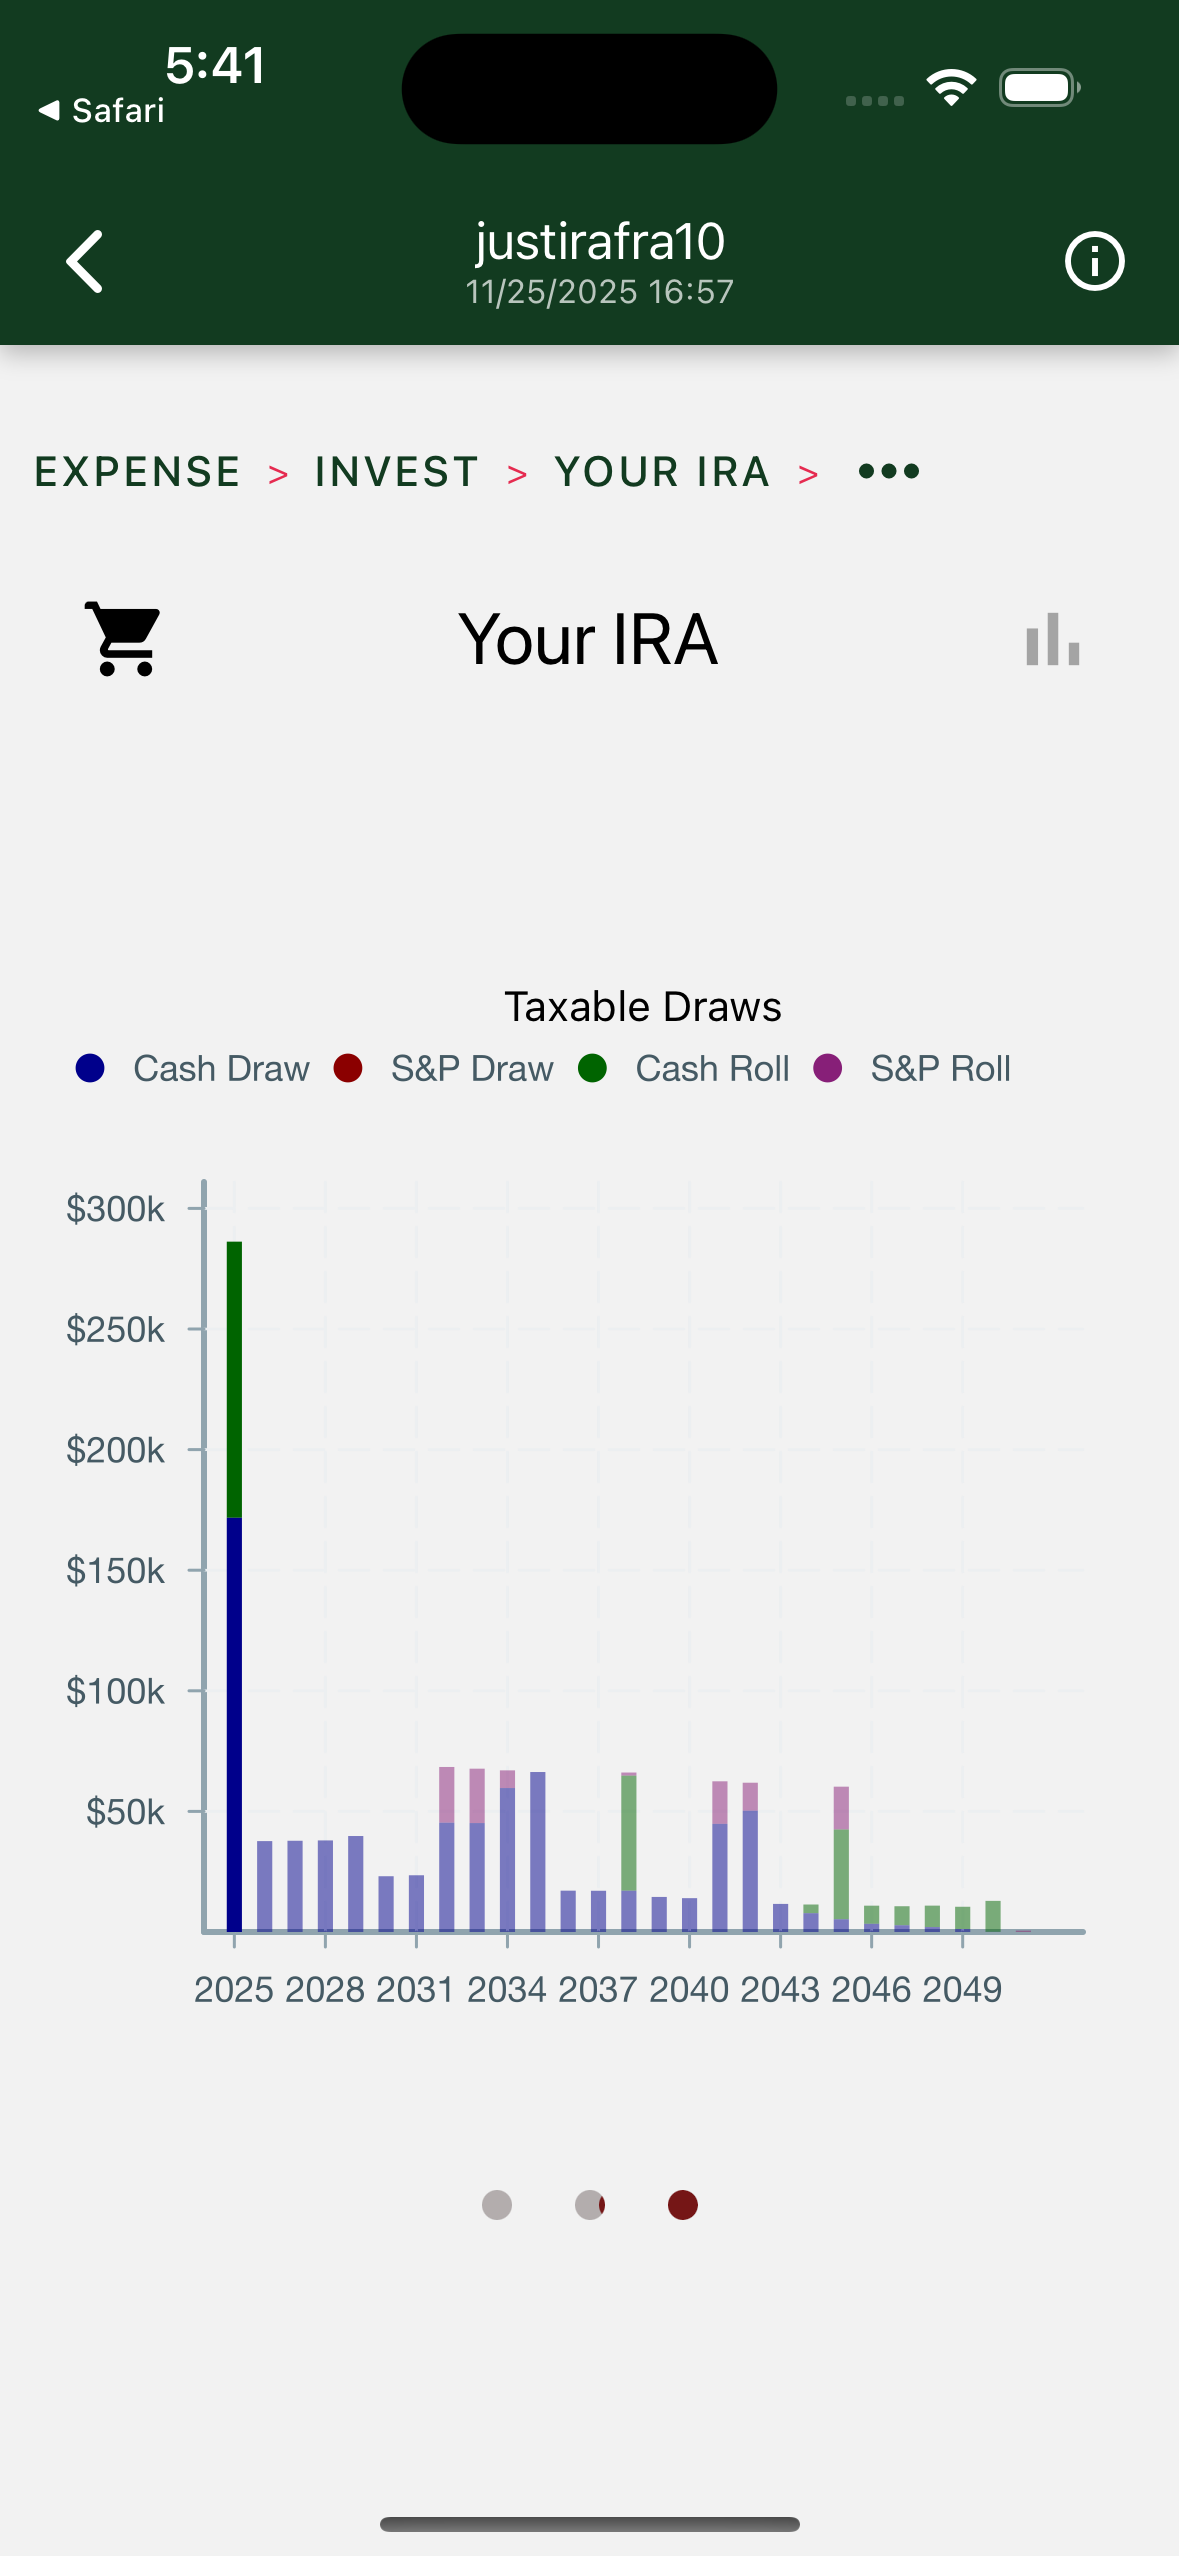
Roth Conversion
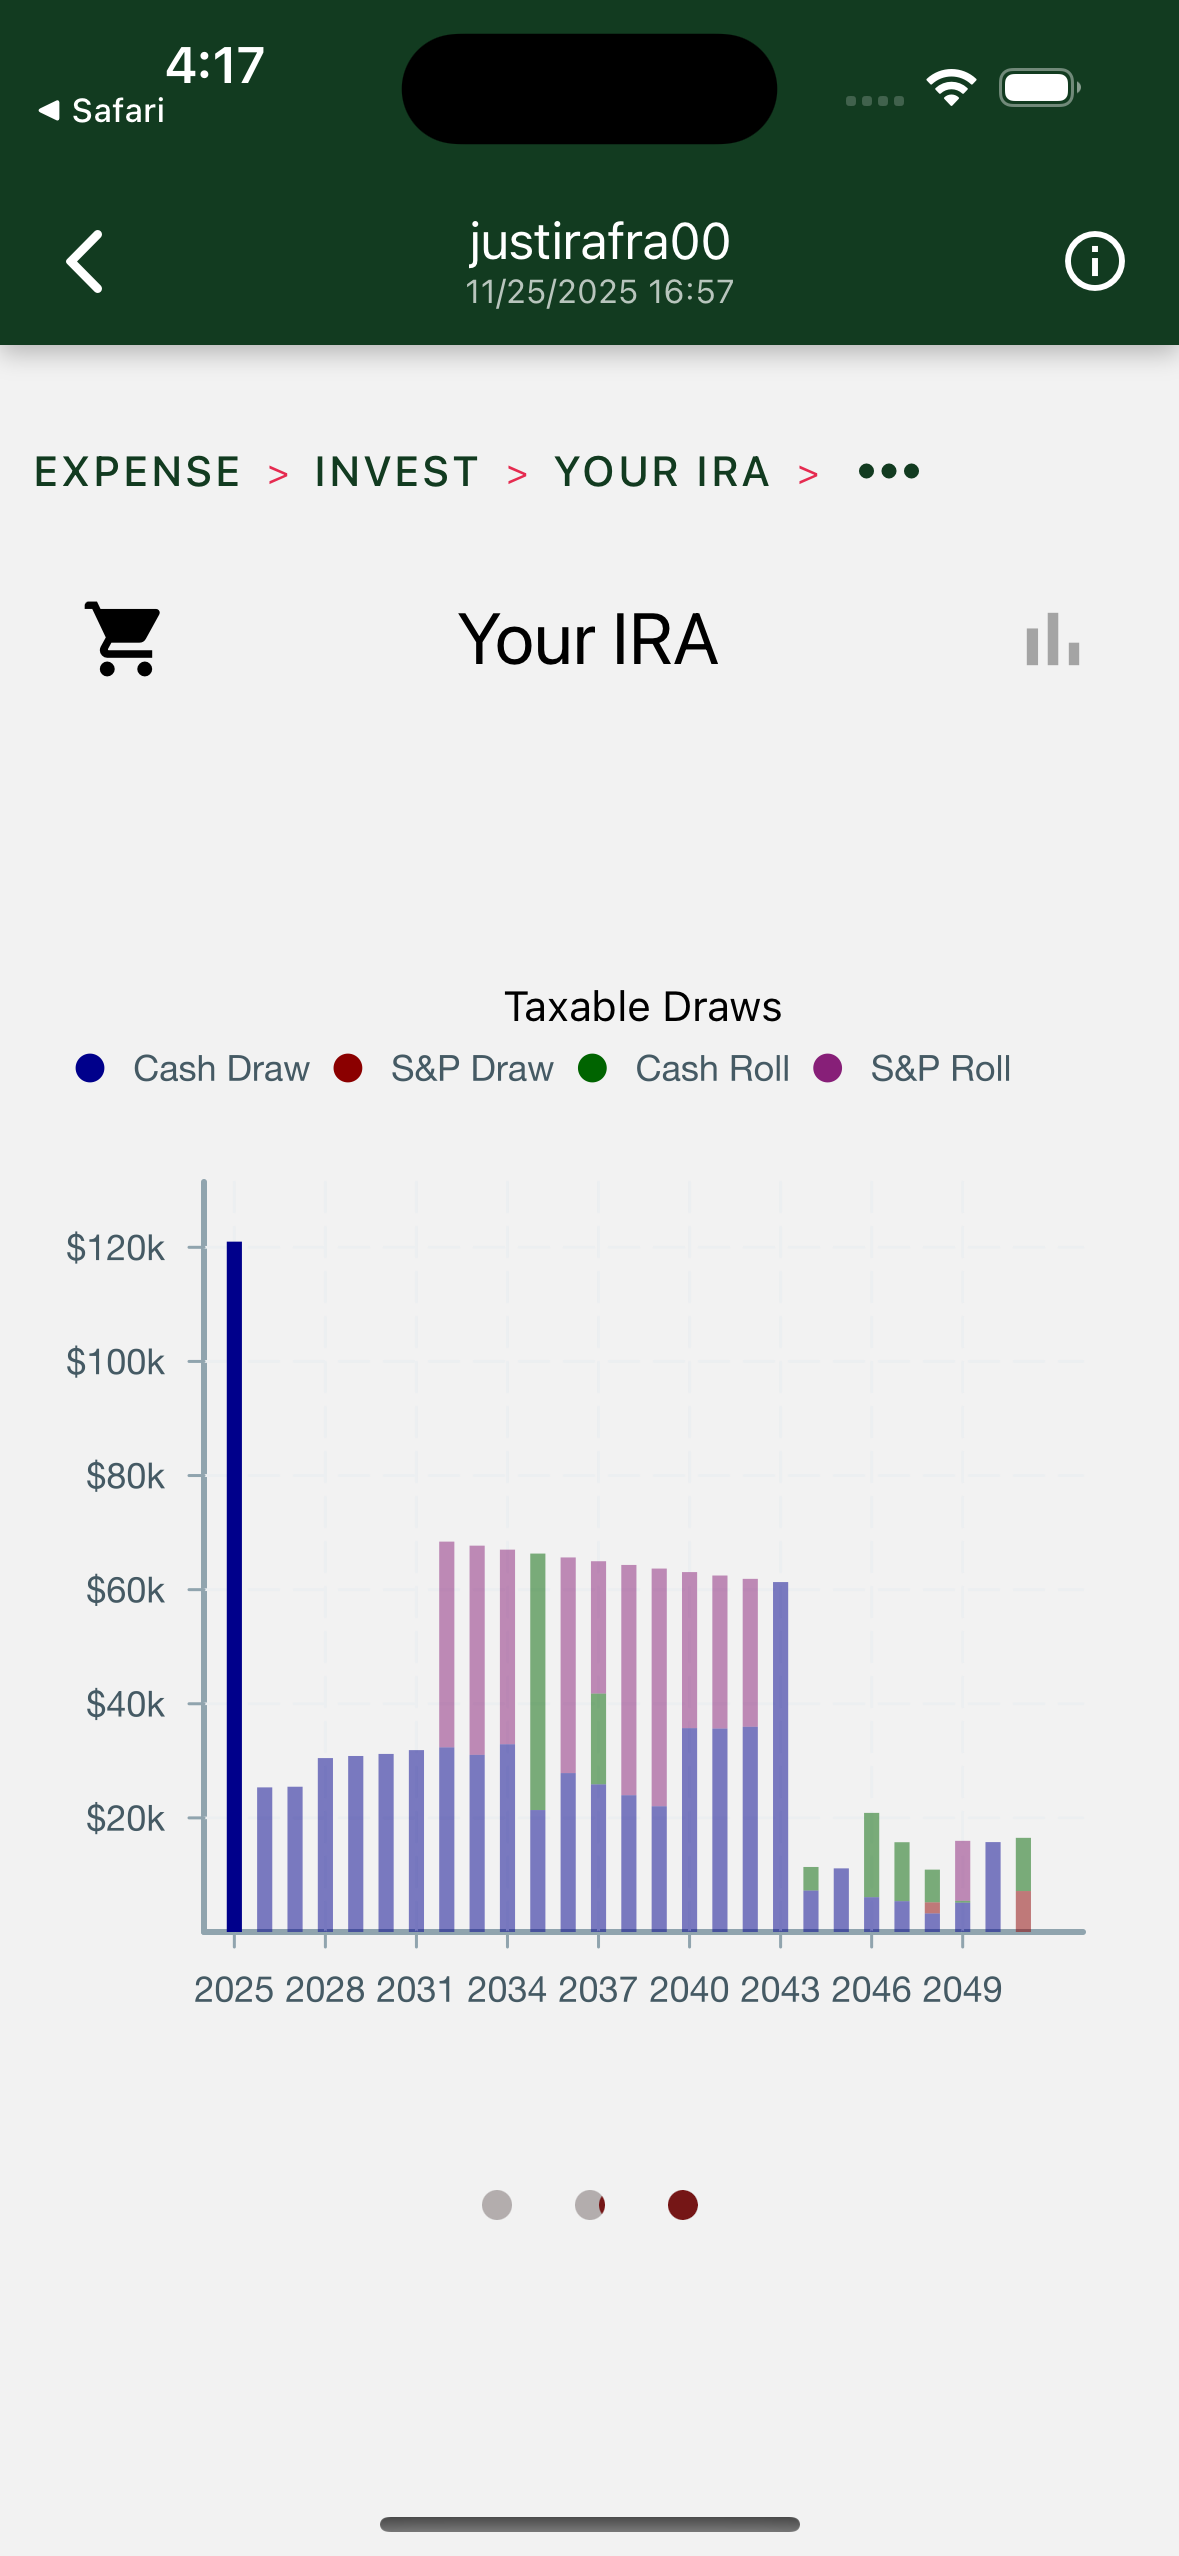
The IRA draws are incorporated into yearly spending. Rollovers charge the Roth account in the middle years.
Blue bars show IRA draws. Violet and green bars show S&P and cash rollovers respectively.
This is not a strategy that anyone would come up with independently. In fact, it only makes sense in the larger context of spending and taxes.
Income Taxes
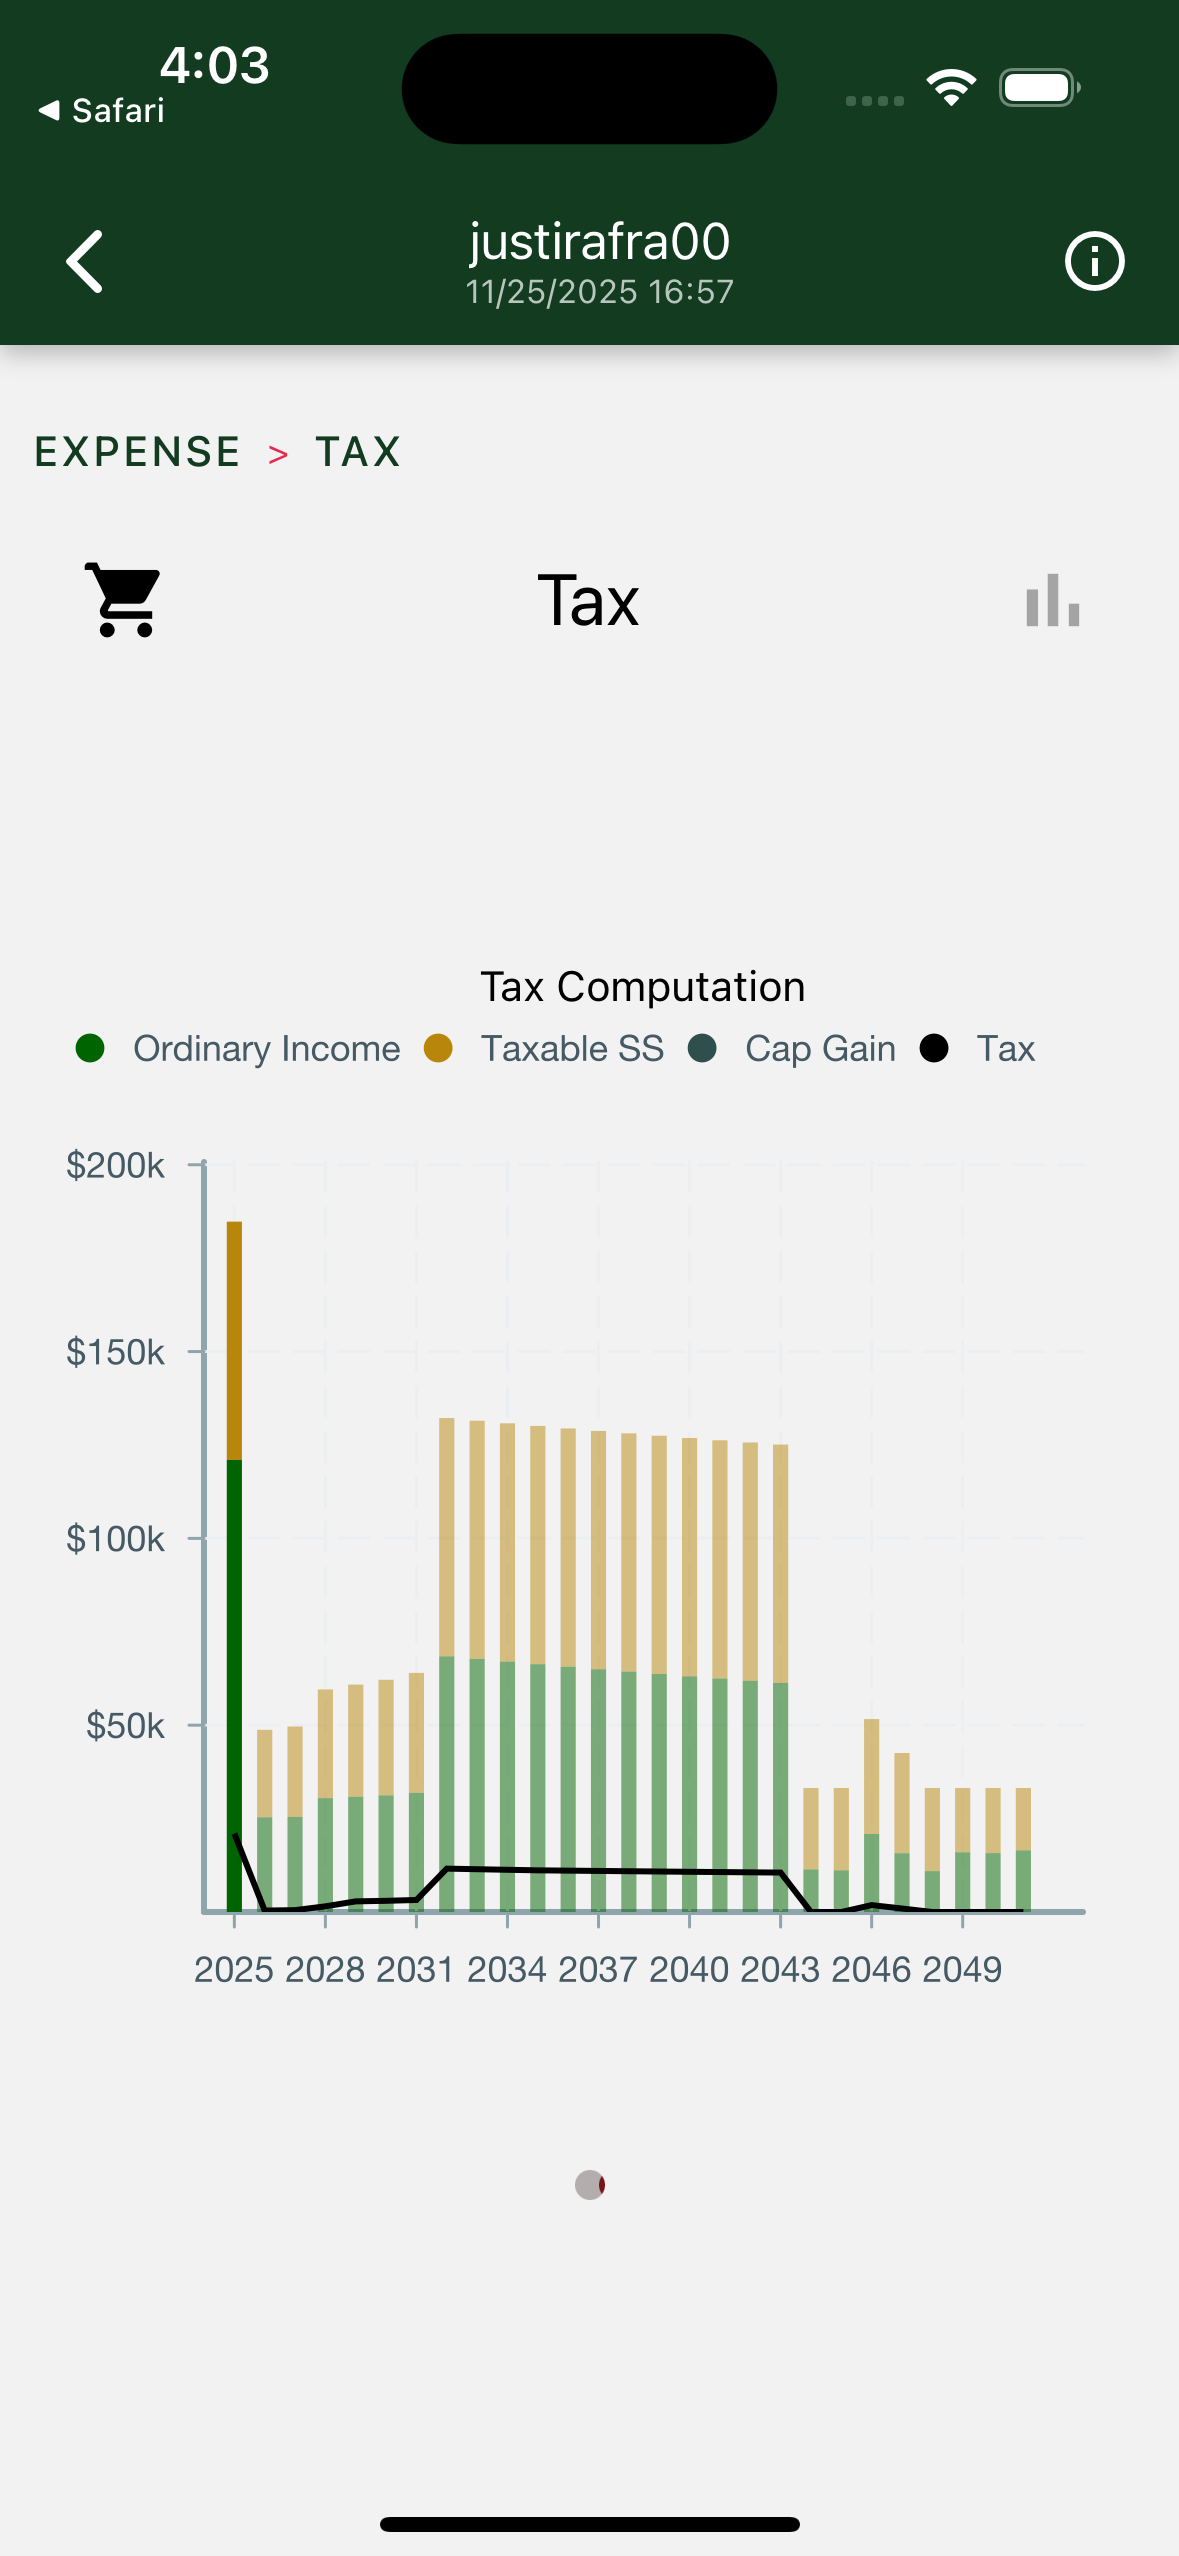
Income tax is levied on two income sources:
- Ordinary income is the sum of IRA draws and rollovers, as seen in the above screenshot.
- Depending on income, between zero and 85% of Social Security is taxable. Taxable SS brackets are not adjusted for inflation, accounting for the sloping bars in chart.
Tax computation falls into four phases:
- 2025 – 20% bracket – $20K tax – Draw $120K to cover one year’s expenses and taxes.
- 2026-2031 – 10% bracket – $3K tax – IRA rollovers have not commenced.
- 2032-2043 – 12% bracket – $12K tax – IRA rollovers max out bracket.
- 2044-2051 – Standard deduction applies – $0 tax – IRA is gone; start pulling from Roth.
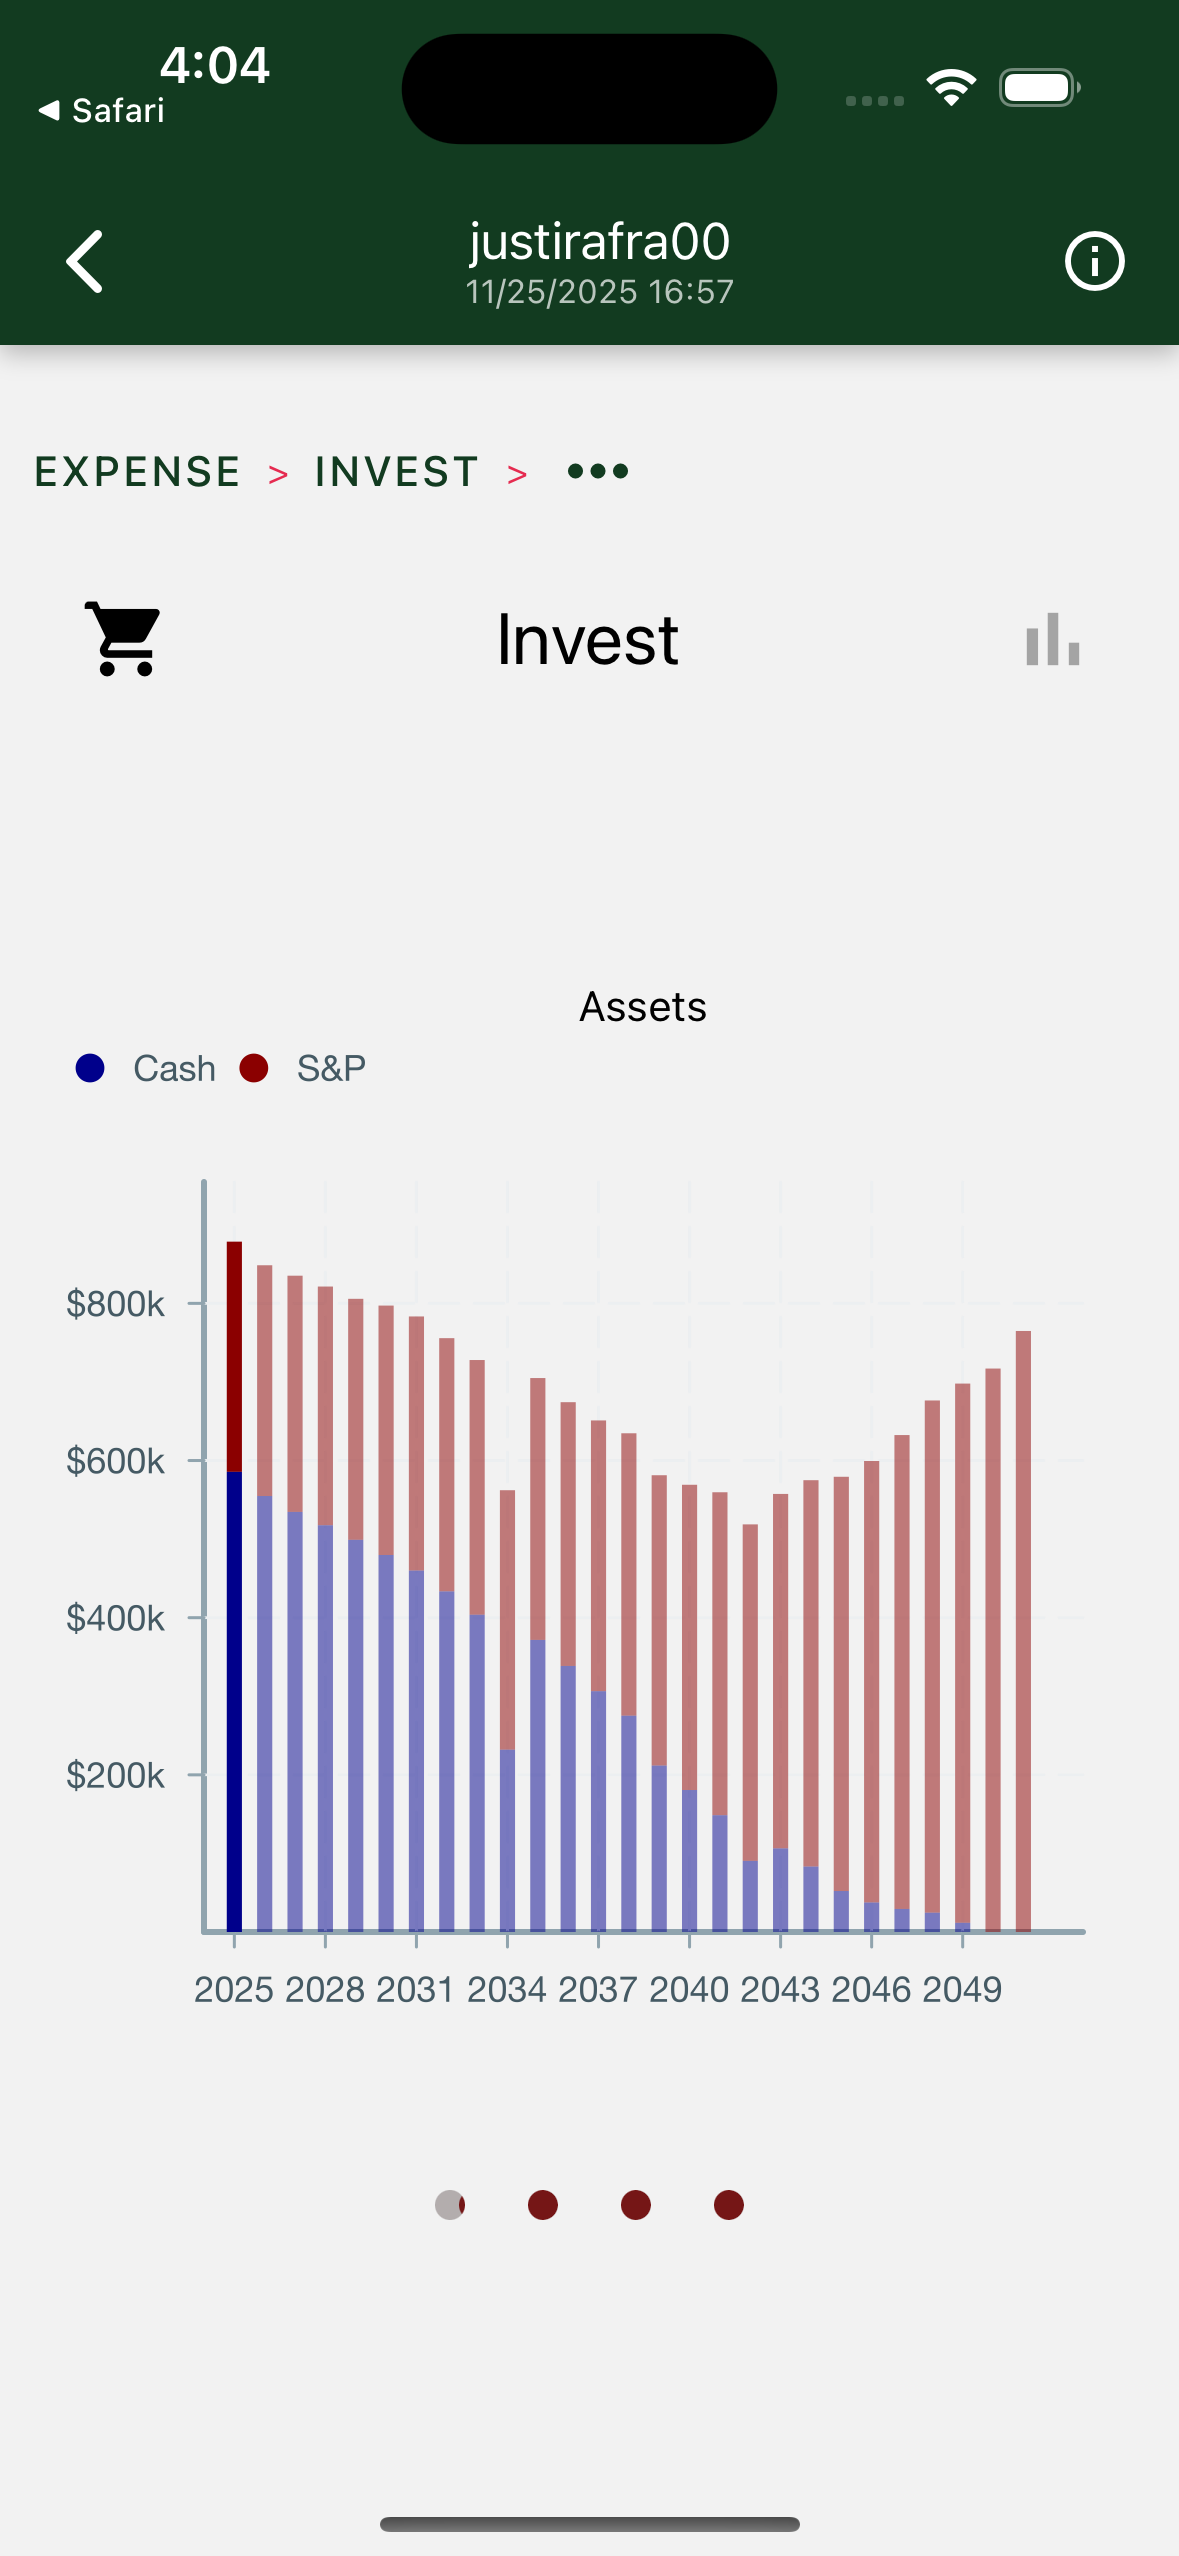
Assets
Do I die with the most money? Well, there are certainly countless portfolios that will outperform this one, and more that won’t, but this one is fully hedged, and is likely to end up looking like this. Some observations:
- I bought $290K of S&P on day zero and didn’t touch it for twenty years, during which I rolled it (and reinvested dividends) all into my Roth account.
- Given today’s historically high stock valuations, the red bars show modest gains for some time, followed by a return to the more typical real yield of around 6%.
- The ending balance is over $700K and climbing. I am not running out of money; my heirs will raise a glass to me in grateful thanks for my prudent investing and after-tax bequest.
The Lesson
Reflecting on my generosity, I decide to see how the heirs will make out if I take $110K/year instead of $100K. I run the new numbers.
I find that results are very sensitive to initial conditions. Instead of $700K, I end up with $70K; I am now concerned about running out of money; my heirs will curse me.
And compare rollovers below with the $100K example above. Completely different! A big tranche on day zero, and very few moves down the line!
Roth conversions are an important part of portfolio management, but they are not the goal. The 4% rule is not the goal. The 60/40 split is not the goal. The goal is to describe the retirement you want, and your wishes for your family, and put it into place, using the tools you have avalable, among them, Roth conversions.
The secret to getting that annuity-like stream of payments that retirees crave is to specify payments, then fund them. Then go out and enjoy your retirement without worrying about the market. You don’t have time for that.
Wall Streets' Focus on Wealth Unproductive
It’s “an impossible math problem.”1
Alison Schrager, in Wall Street Just Doesn’t Get Retirement, points to confusion and frustration felt by prospective retirees who have no idea whether or not they are on the right track to retirement. She blames the financial industry’s focus on wealth to the exclusion of daily income needs, concluding:
But the goal of retirement finance isn’t your wealth level on a particular day. It is predictable income for the length of your retirement. Getting this basic premise wrong burdens retirees with an enormous and intractable risk.
In the end, she calls on the financial industry to provide better benchmarks and products and promote them in statements and customer communications, regrettably adding that “Making actual changes is just about impossible.”
Hedgematic offers a possible way out of this dilemma.
Hedgematic
Hedgematic is an app that, based on your unique position, constructs a hedged after-tax income stream to cover your individually specified yearly needs for the duration of your retirement. Figures are expressed in today’s dollars and are tax-optimized. Allocations are made via a public algorithm, with sound economic support.
The Recipe
Hedgematic Portfolios
Serves 1 or 2.
Gather ingredients.
- Your birthdays and tax status
- Your lifetime/health percentile rank (Sorry, gotta ask.)
- Current dollar income requirements for each of your remaining years of life.
- Estimated Social Security benefit (plus start age if not “full retirement age”.)
- Your after-tax, IRA, and Roth account balances.
Form one hedge for each remaining year of life:
- Roll out a base of TIPS inflation protected bonds.
- Top with some spicy S&P average. Consult Robert Shiller’s CAPE10 work to get the risk-adjusted proportions just right.
Combine ingredients and hedges in optimizer bowl and process until smooth.
Your Hedgematic Portfolio is Ready to Serve
Start with an amuse bouche: Answers to your biggest questions (benchmarks, if you will):
- Do I have enough to retire?
- If not, what’s the shortfall? When can I actually start?
- If so, what is the size of my estate (in current dollars)?
Once your appetite is stimulated, dig into other delicious offerings:
- Day-zero broker-ready shopping list for each account includes:
- An S&P ETF purchase order summing tranches targeted at each of your following years.
- A ladder of TIPS bonds to drop off yearly inflation protected cash.
- A year-by-year list of all transactions that hit your accounts. This includes the yearly S&P tranche sale, bond redemptions, interest payments, social security benefits, reinvested dividends, and IRA draws and rollovers.
- A tax return for each year. Note that yearly draws include estimated taxes in addition to your after-tax income requirement. Note also that IRA draws and rollovers are scheduled to minimize total taxes over the length of your retirement.
- Lots of charts.
Not to Your Taste?
Too rich? Thin gruel? It’s ok! Adjust your ingredients and make up another batch. With repeated experiments, you will find the combination that’s right for you!
Larry Fink, BlackRock CEO. ↩︎