This is the multi-page printable view of this section. Click here to print.
Documentation
- 1: Overview
- 2: Your Hedgmatic Profile
- 2.1: For Starters
- 2.2: Your Information
- 2.3: Your Spouse's Information
- 2.4: Social Security
- 2.5: Your Expenses
- 2.6: Your Balances
- 2.7: Review
- 3: Your Hedgmatic Results
- 3.1: Expenses
- 3.1.1: Investments
- 3.1.2: Social Security
- 3.1.3: Taxes
- 3.2: Asset Classess
- 3.2.1: S&P
- 3.2.2: TIPS Bonds
- 3.2.2.1: TIPS Bond
- 4: The Hedgematic Portfolio
- 4.1: TRCAPE vs. Future S&P Returns
- 4.2: TRCAPE and Reinvested S&P Earnings
- 4.3: TRCAPE and S&P Price
- 4.4: S&P Earnings Volatility
- 4.5: US Treasury Inflation Protected Bonds
- 4.6: Hedge with a TIPS/S&P Mix
- 4.7: Combine Yearly Instruments
- 5: More Info
1 - Overview
An aging population asks?
- Do I have enough to retire?
- How much longer must I work?
- Will my money last?
- Can I trust anybody to look out for my interests?
The wealth management industry feeds on these anxieties, but:
- Skims entrusted funds.
- Provides one-size-fits-all products.
- Inaccessibly sequesters funds.
- Punts on taxes. “Consult your tax advisor.”
- Demands you trust their secret “proprietary” algorithms.
- Evades responsibility by e.g. making you responsible for portfolio apportionment, giving you only crusty “rules of thumb” for guidance. This from the purported experts.
The Hedgematic Portfolio is an alternative to traditional wealth management products.
How does Hedgematic work?
- Fill out a questionnaire with demographic info, account balances, and required yearly expenses.
- Click “compute”. When results are ready, you are notified.
- Results include graphs and tables that list all transactions, which once executed, subject to your risk tolerance, provide a hedged lifetime stream of payments sufficient to cover yearly expenses.
- If funds are sufficient, the size of your estate is provided. Otherwise, shortfalls are listed for affected years, showing you the additional savings you need to commence your retirement, or your retirement date given no increase in your assets. Recompute with different expenses or risk tolerance until satisfied.
- Results are:
- After-tax.
- Today’s dollars.
- Tax-optimized.
How is it hedged?
- Each year of retirement is separately funded and hedged. All assets are held long.
- Assets dedicated to each year are apportioned between:
- S&P (via ETF)
- TIPS inflation protected bonds.
- Withdrawals are denominated in:
- Inflation adjusted dollars.
- S&P index multiples.
- Apportionment is based on a model derived from work by Robert Shiller (Case-Shiller Housing Index, CAPE10, “Irrational Exuberance”, Nobel Prize), who observed that a ten-year moving average of stock market returns can explain, in part, future returns.
- You don’t run out of money. Yearly payouts may exceed expenses or fall short. Risk tolerance is accounted for by an aversity figure. 1 is the default.
Compare the Hedgematic Portfolio to traditional offerings:
- Everyone gets either:
- A retirement date and dollars needed to retire today, or,
- A green-light on retirement and the likely amount of any remaining estate.
- Funds will not be exhausted.
- You retain control of your assets. No institutional risk.
- No service charges.
- All assets are held long. Market risk controlled.
- Income satisfies user’s individually specified year-by-year expenses.
- Open, transparent algorithms based on unimpeachable economics.
- Social security payments are optimized and incorporated.
- Taxes are optimized.
- Results include yearly tax returns.
- Optimizes withdrawals over brokerage, IRA, and Roth accounts.
- Schedules optimum rollovers between IRA and Roth accounts
- Optimizes S&P sales for capital gains treatment.
- Dividends get capital gains treatment.
2 - Your Hedgmatic Profile
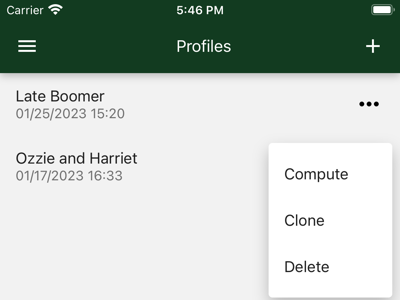
Hedgematic maintains a list of your profiles. You might create several profiles to see the effects of different choices you have.
Create your first Hedgematic profile by pressing the plus sign, proceeding to describe yourself and your retirement position:
- Demographics: e.g. Birthday, age, and sex.
- Social security: Estimated check? Have you started?
- Expenses: After tax, after inflation spending requirements for each year of your retirement.
- Balances: Your assets by account.
Once you create a profile, select the dot menu to access the following actions:
- Compute a complete after-tax retirement portfolio, hedged against market risk and inflation. Can I retire today? If not, how much am I short? When do I start social security?
- Clone a profile to create a new profile, based on the existing one. Stack them up against each other. There is no “edit profile” feature." This is so you can repeatedly run scenarios over time and compare the results. Instead of editing, clone an existing portfolio, enter a new name, and apply your changes.
- Delete a profile, and any computed results for it.
If you just tap the profile you get a summary of that profile’s settings.
2.1 - For Starters
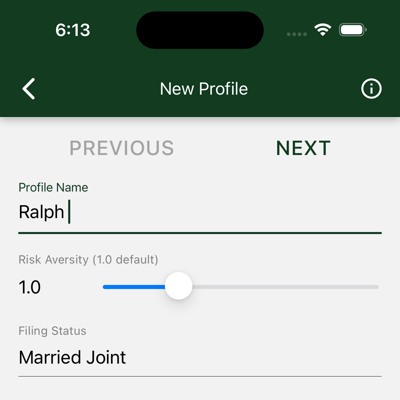
When creating a new profile, Hedgematic guides you through some initial data collection. To get started, you first provide three values.
Profile Name is displayed with the profile and any results computed from that profile. It is required and must be unique.
Risk Aversity requires some explanation. Your portfolio works like a variable annuity. For the remainder of your life, your portfolio pays you every year. The default value is 1.0. Lower numbers increase the chance that individual years may come up short. Higher values offer more security. Recommended: 1.0 is tuned to give you the maximum estimated risk-adjusted return. Lower values are more likely to risk principal; higher values approach a cash-only portfolio.
Filing Status is your IRS filing status. It is used for two purposes:
- Hedgematic uses this value when computing taxes on your portfolio.
- If you select ‘married’, Hedgematic will ask for information about your spouse and incorporate it in the analysis.
Buttons at the top of the page are used to navigate through these initial dialogs:
- PREVIOUS takes you to the previous page (if available).
- NEXT takes you to the next page (if available).
- SUBMIT Seen on the last page, saves your new profile and returns to the Profiles page
You can’t click these buttons if there are any errors on the page. Fix them first.
If you click the back arrow, profile creation is cancelled and you are returned to the profile list.
2.2 - Your Information
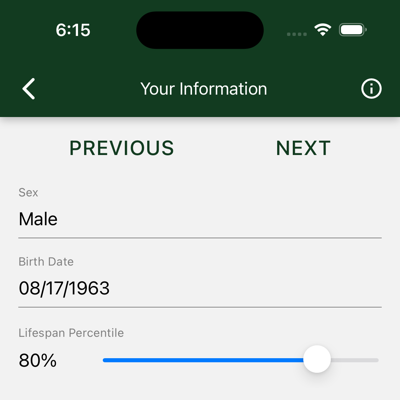
Use this form to enter personal data and social security information.
- Sex: Male, Female, or Unspecified. Birth Date, Sex, and Lifespan Percentile are used to calculate your lifespan and consequent Social Security payments.
- Birth Date: Your date of birth.
- Lifespan Percentile: A number between 1% and 99%. If you think you will outlive 75% of your High School class, enter 75.
2.3 - Your Spouse's Information
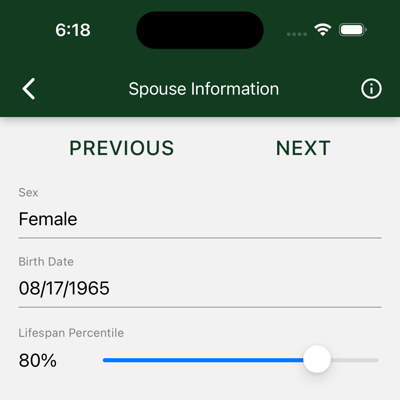
If you selected “married joint” for your tax filing status, you will be shown this form. It looks like the previous page, which can be confusing. Use this form to enter personal data and social security information for your spouse.
- Sex: Male, Female, or Unspecified. Birth Date, Sex, and Lifespan Percentile are used to calculate your lifespan and Social Security payments.
- Birth Date: Your date of birth.
- Lifespan Percentile: A number between 1% and 99%. If you think you will outlive 75% of your High School class, enter 75.
2.4 - Social Security
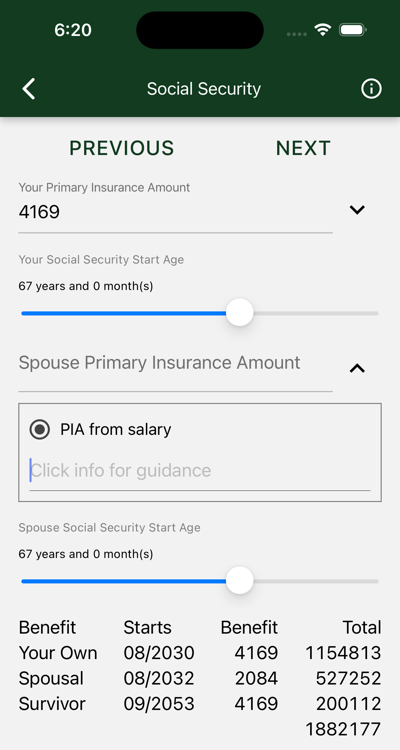
Hedgematic incorporates your social security payments into your profile and uses them in its computations. Use this dialog to provide social security information for you and your spouse.
Social Security Terms
Social Security, and Hedgematic, use certain terms to discuss Social Security concepts:
- Your Start Age is the age, expressed in years and months, you start taking Social Security benefits.
- Your Full Retirement Age, or FRA, is the Start Age where Social Security says you get your “full benefit”. It is determined by the year you were born.
- Your Primary Insurance Amount, or PIA, is the gross benefit you get if you retire at your FRA.
- Your Gross Benefit is your benefit before Medicare or other deductions.
- Your Social Security check is your gross benefit less deductions.
- If you start Social Security before or after your FRA, you get a smaller or larger gross benefit.
Hedgmatic uses your PIA and start age to compute your gross benefit. If you don’t know your PIA, Hedgematic can use your start age and associated gross benefit to compute your PIA.
You can see these numbers by creating a Social Security account at ssa.gov/myaccount. You also may get a yearly mailed Social Security Statement that contains the same information. Depending on your age, and whether or not you are already taking Social Security, different figures are provided:
- If you are already taking social security, you see gross benefit, but no PIA.
- If you are not yet taking Social Security,
- And you are younger than your FRA, you see your PIA, aka “estimated benefit at full retirement age.
- If you have passed FRA, you see the gross benefit if you retire today, from which the PIA can be computed.
Filling in the Primary Insurance Amount
I don’t have my Social Security Statement
Hedgematic will create a rough estimated PIA based on your current salary.
- Drop the helper in the “Primary Insurance Amount” field.
- Select “Salary”.
- Enter yearly salary
- Helper closes, estimated PIA is shown.
I’m Already Taking Social Security
- Drop the helper in the “Primary Insurance Amount” field.
- Select “Benefit”.
- Enter gross benefit (your check before deductions). This is also available on your SSA account, or your yearly mailed COLA letter.
- Helper closes, estimated PIA is shown.
I’m Younger Than 62
- You don’t see the Benefit helper. It only works if you are old enough for Social Security. Use the salary estimator, or,
- Your PIA is called out on your Social Security Statement. Enter PIA in the “Primary Insurance Amount” field.
I’m Older Than 62 and not taking Social Security
- If you are younger than your full retirement age, your statement provides your PIA. You can go ahead and enter it.
- Once you are past full retirement age, your statement no longer tells you your PIA. It does, however, tell you your gross benefit if you retire at your current age.
- Drop the helper in the “Primary Insurance Amount” field.
- Select “Benefit”.
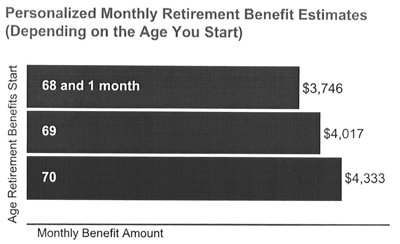
- Enter your Personalized Monthly Retirement Benefit Estimate for your current age. Below, the number is $3746.
- Helper closes, estimated PIA is shown.
Setting the Social Security Start Age
Start Ages for you and your spouse are initially set to your FRAs.
Drag the slider to try different start ages.
After changes are made, updated social security benefits are displayed and totaled. Numbers are in today’s dollars. Your actual check will increase with inflation every year.
Important: Your social security start age need have no relationship to the day you stop working. Depending on your assets and expenses, you can often retire well before your first social security check.
2.5 - Your Expenses
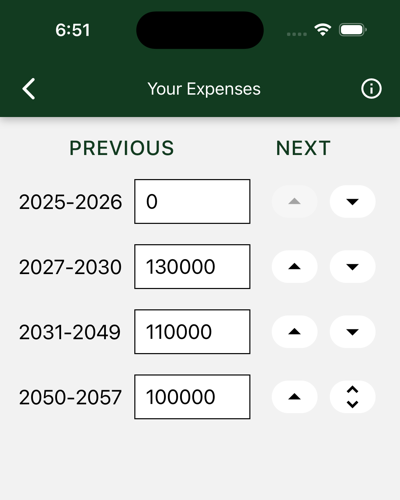
Hedgematic allows you to specify income requirements for each individual year of retirement. These figures should be entered in today’s dollars. Values should be required actual after-tax take-home pay. Hedgematic draws will include estimated taxes in addition to these numbers. And you won’t be making retirement contributions either.
If you need the same amount every year, starting today, just type it in and move on. Hedgematic will tell you when your retirement can start.
If you anticipate different income requirements for upcoming phases of your life, set up multiple intervals and assign needed income to each, using the buttons at the end of each row to:
- Split the last year off into its own new row.
- Move the last year of an interval down into the next row.
- Move the first year of an interval up into the previous row.
- Remove a one-year interval, by combining it with the previous row.
For example:
- Our illustrated couple are ages 60 and 62. They wonder if they can retire in two years. They put zero expenses in the first two years.
- They have a mortgage that will be paid off in 2030. They split off a second row, and enter enough to cover their mortgage and expenses.
- The third row covers their active retirement after the mortgage is paid.
- As they approach their eighties, they figure they’ll stay closer to home.
Hedgematic results will include the size of the estate resulting from the expenses you describe here.
2.6 - Your Balances
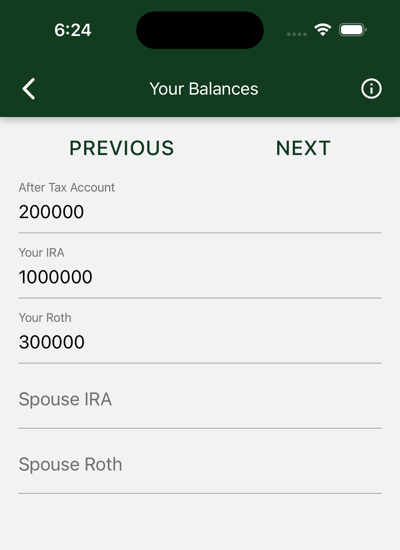
List your accounts and their balances. If you have multiple accounts in the following categories, aggregate their balances and enter the total in the appropriate category.
After Tax is the balance of your savings that are not deposited in retirement accounts. Include accounts for you and your spouse. For this and other accounts, leave the entry zero if no balance or no account.
Your IRA is the account balance of your IRA or 401K.
Spouse’s IRA is your spouse’s IRA or 401K balance.
Your Roth is your Roth or equivalent account balance. Hedgematic will schedule rollovers from your IRA as part of tax computation. There are some rules about transactions in a new Roth account, so go ahead and get one, even if you have no deposits to make yet.
Spouse’s Roth is your spouse’s Roth balance.
2.7 - Review
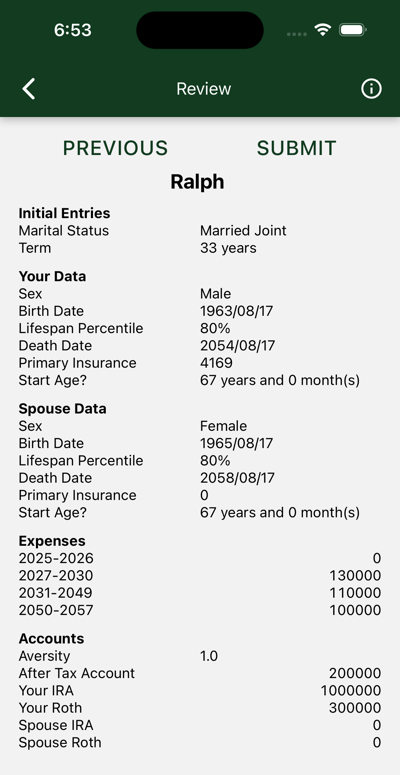
Review your new profile before pressing SUBMIT to save it.
You may use the PREVIOUS button to go back and fix any errors. (Warning: The back arrow at the top of the page will discard your efforts.)
You will not be able to edit this profile after you submit it. This is so you can compare results over time with the same data. You can always delete this profile and make another, or clone this profile and make edits in the new profile.
3 - Your Hedgmatic Results
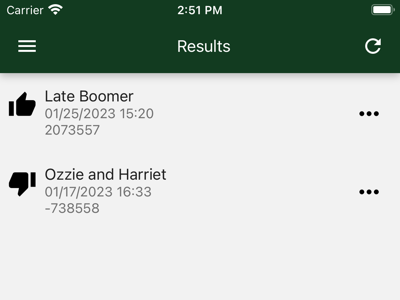
Every time you compute results for one of your profiles a row is added to this list.
Each entry includes the name of the profile, the date it was computed, and the over/short dollars.
Thumbs up means all your expenses are covered; the dollar figure is your estate.
Thumbs down means you have to add money or reduce expectations before commencing your life of leisure.
Tap the row to display the results of one computation.
The dot menu allows you to delete the result (leaving the profile untouched).
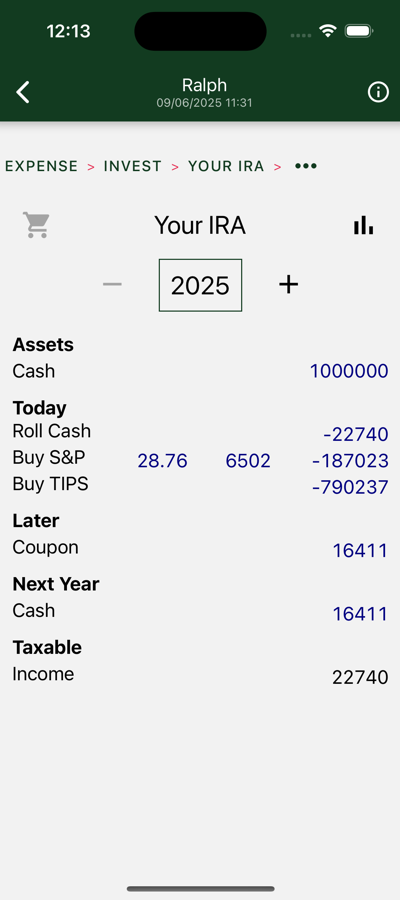
3.1 - Expenses
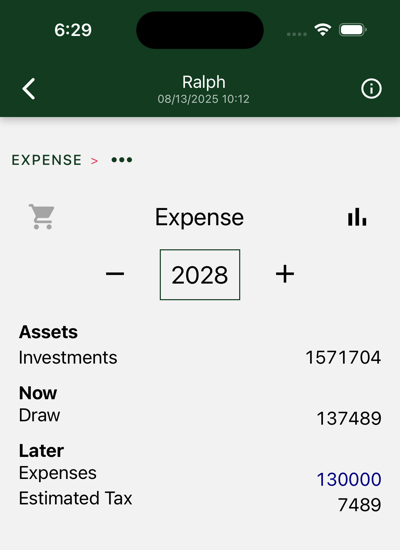
This is the first result screen you will see. Did you make your expenses. Are you over? Where are you short?
This, and succeeding screens, share navigation features.
- At each level, you can select the cart view or the chart view. Illustrated is the cart view. The cart view is where you find listed the actions you take today and on succeeding yearly anniverseries, as well as asset summaries and anticipated transactions over the course of the remainder of the year.
- Get the numbers for each year by changing the year.
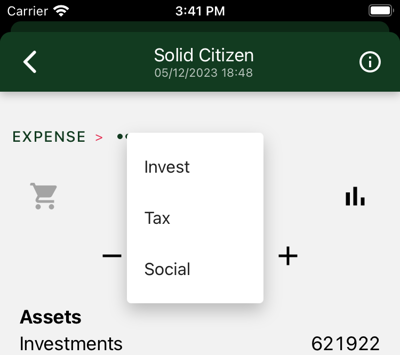
The breadcrumb at the top of the page lets you drill down on result details and pop back up. Tap the dots to select drill-down options. Here we have Investment, Tax, and Social.
The back arrow returns you to the result list. Return to the top level by tapping EXPENSE in the breadcrumb.
Charts
Tap the chart icon to see charts for each level.
Usually, multiple charts are available. Swipe to view each in turn.
Tap inside the chart to change the cart view display year.
Tap the cart view icon to switch back to cart view.
At this level three charts are available.
Where do we get it?
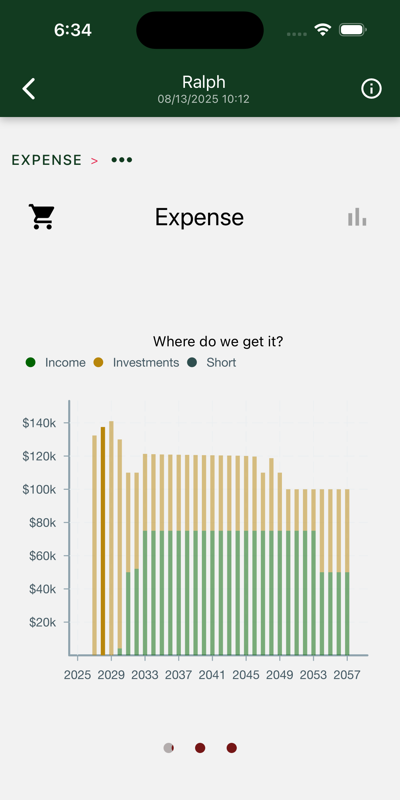
Data is displayed for the duration of your retirement. In this case we see retirement starts in two years.
Bars represent the actual payments from investments or cash income and, if applicable, any shortfall between that income and your required expenses. Cover the shortfalls and you are ready to commence retirement.
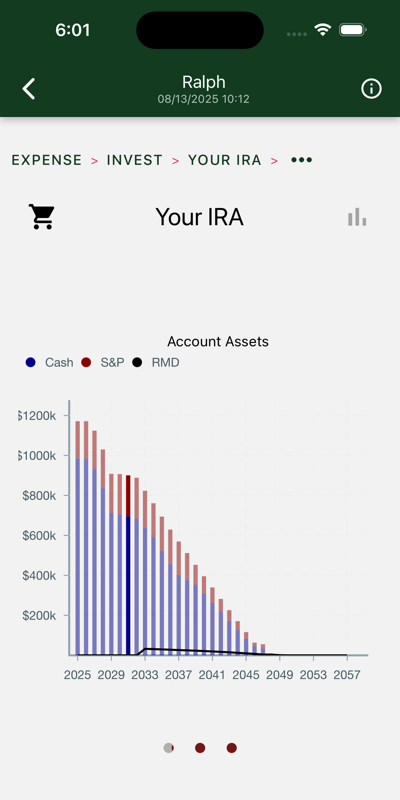
What have we got?
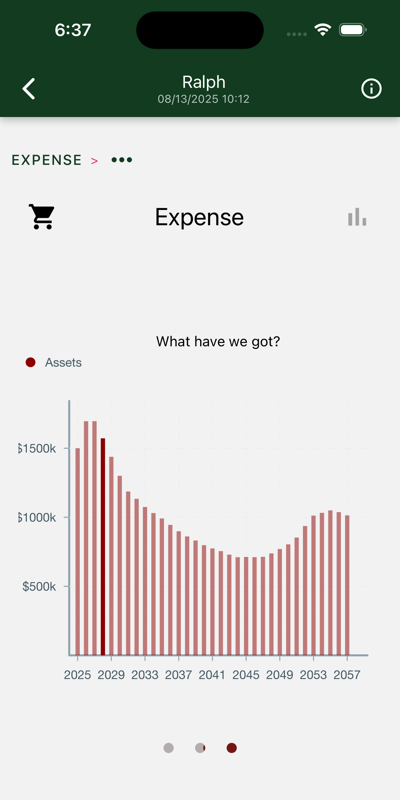
Shows total balance over years in your investment accounts. In this case we see assets diminishing until Social Security really kicks in. After many comfortable years, Ralph dies, and the Mrs., on reduced payments, starts to draw down the balance, eventually leaving a million to her heirs.
How do we spend it?
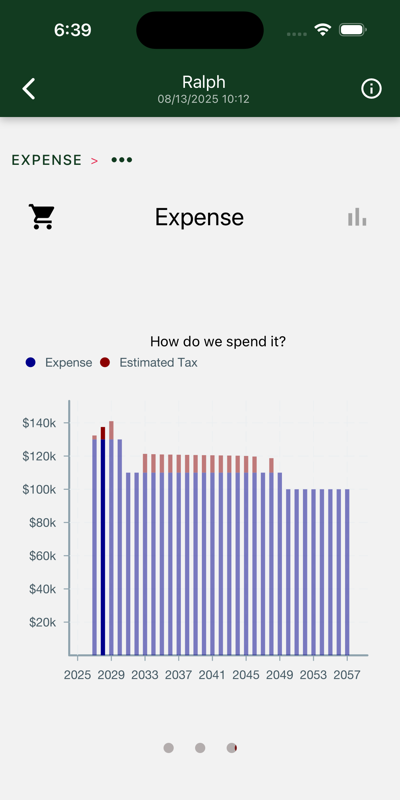
Your expenses are your desired current-dollar, after-tax expenses, plus estimated taxes you need to pay. Note that you never paid more than $11K in taxes.
3.1.1 - Investments
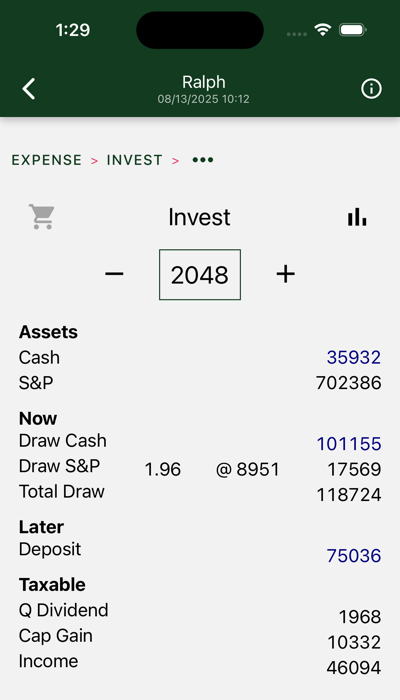
Your assets are divided between after-tax and retirement accounts. Within each account, assets may be held in “cash,” including inflation-protected bonds, or S&P index instruments.
In this year, we draw cash and S&P. Cash draws are denominated in current dollars. The blue font is used to distinguish actual current dollar figures from modeled estimates of market performance. The S&P withdrawal is denominated in S&P units, or multiples of the S&P average (predicted to be $8951 in 2048). It will vary depending on market performance. Note that, given current valuations, we are depending on the market for only 15% of our 2048 income.
The draw includes $110K of after-tax expenses and an estimated $8724 tax payment.
Figures at the bottom show tax inputs from your before-tax account and traditional IRA(s).
Charts
Four charts are shown. Swipe to view each in turn.
Drill down further in results to see similar charts for each separate account. Charts on this page show totals across all of your accounts.
Assets
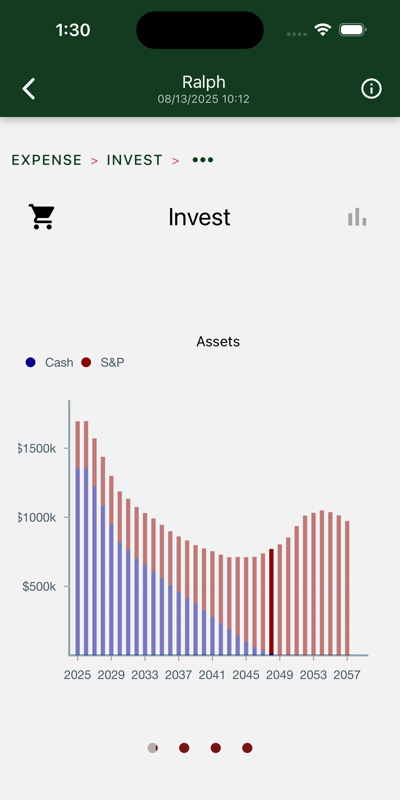
Yearly total account balances, with “cash” and S&P assets highlighted. Cash assets are reserved for the early years, when stock market volatility poses the greatest risk and you don’t have social security to anchor your hedge.
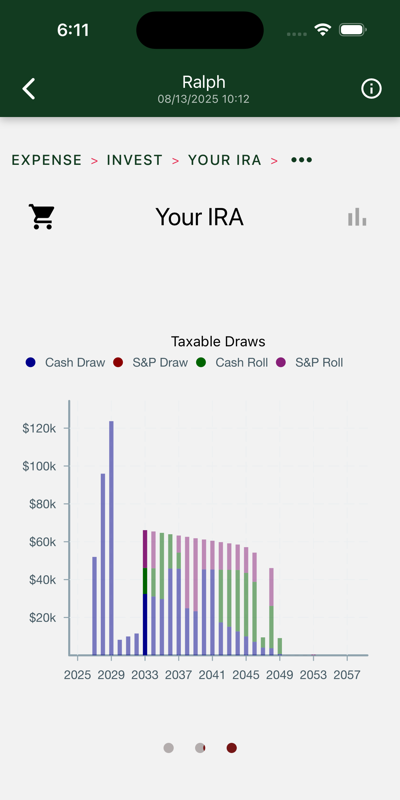
Source of draws
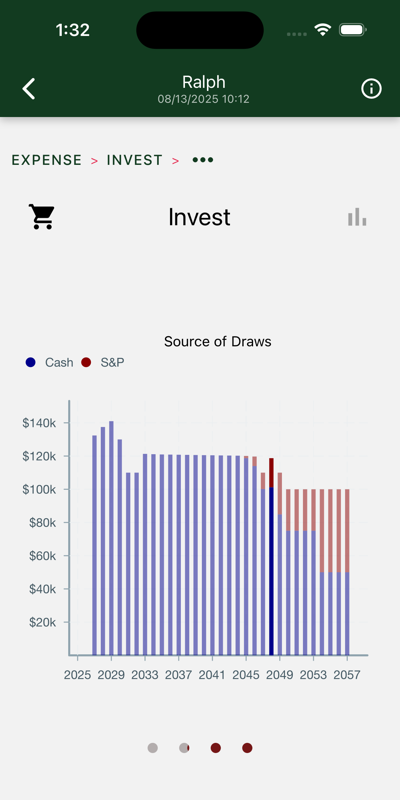
Withdrawals from your investment accounts. Cash assets are consumed first, until the higher expected returns of the stock market catch up to and overtake their expected risk.
Required cash percentage
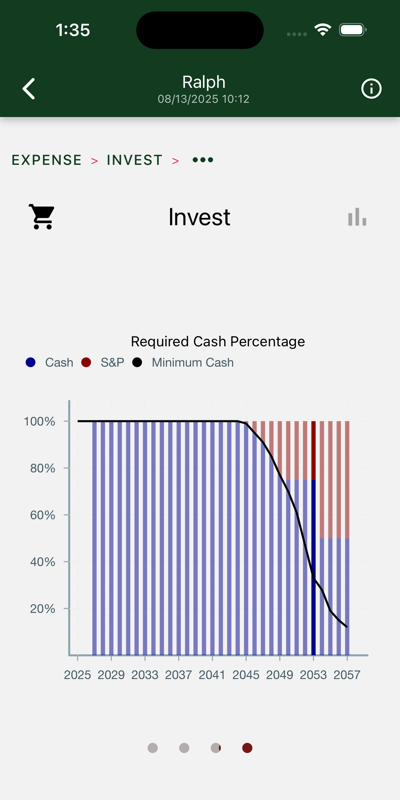
The bars show the percentage of cash assets in each year’s draw. The line shows the required percentage. The bars and line diverge when social security is suffiecient to cover the cash portion of your hedge.
These percentages vary greatly depending on a ten-year moving average of market valuations. The 2023 version of this chart has you all in on stock by 2043.
Tax inputs
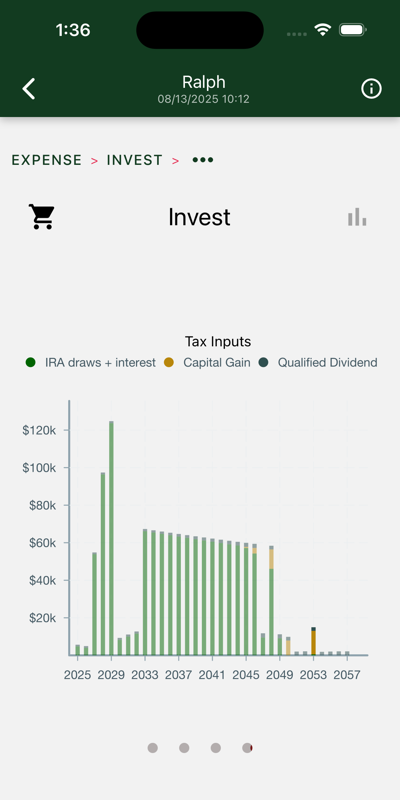
These numbers are entered on your tax return. They come from two sources:
- After tax account:
- Ordinary income from bond interest.
- Imputed ordinary income from bond inflation adjustments
- Qualified dividends from S&P ETFs. These are reinvested.
- Capital gain on S&P draws.
- Traditional IRAs
- Withdrawals are taxed as ordinary income.
- Rollovers to Roth accounts are also treated as ordinary income.
In this case, IRA draws are the biggest contributor.
3.1.1.1 - Broker
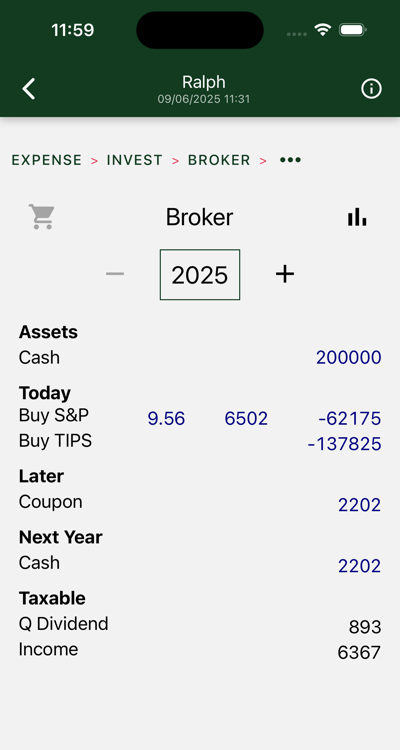
This is your “broker” or after-tax account.
Required actions are shown for each year. Drill down to see details. The illustration shows the transactions used to set up the portfolio in the first year, in this case, an S&P purchase, and a ladder of TIPS bonds that mature over the first years of the portfolio.
Bond and social security income accrues over the remainder of the year. It is carried over to the next year, where it is typically pulled with the cash draw. (On those occasions where it is not, inflation is charged.)
Charts
Three charts are shown. Swipe to view each in turn.
Account Assets
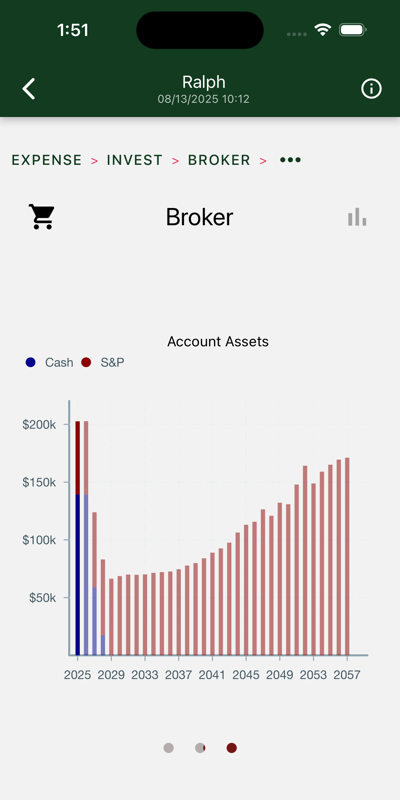
Yearly total account balances, with “cash” and S&P assets highlighted.
Here we see we took our cash and bought some bonds and S&P. The bonds are gone pretty quick. The stock is held to the last years of retirement, when the IRA is gone and the capital gains can be drawn tax free. $150K goes to heirs.
Account Activity
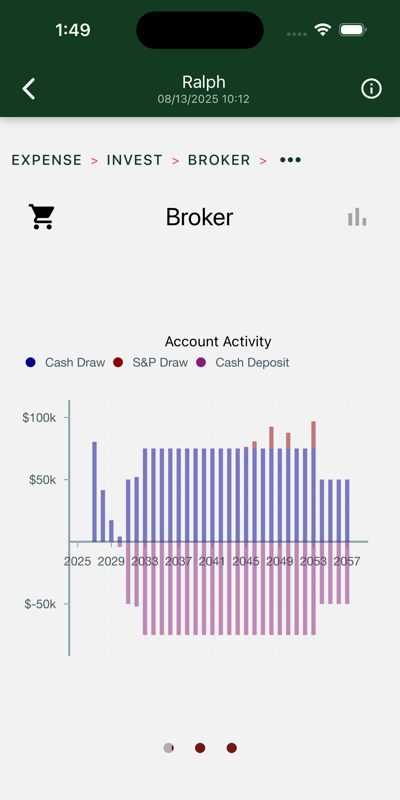
In this chart, we see an initial set of withdrawals used to support us for the first three years. On the right side of the chart we mostly see social security deposits being deposited, then withdrawn to support the succeeding year.
Tax inputs
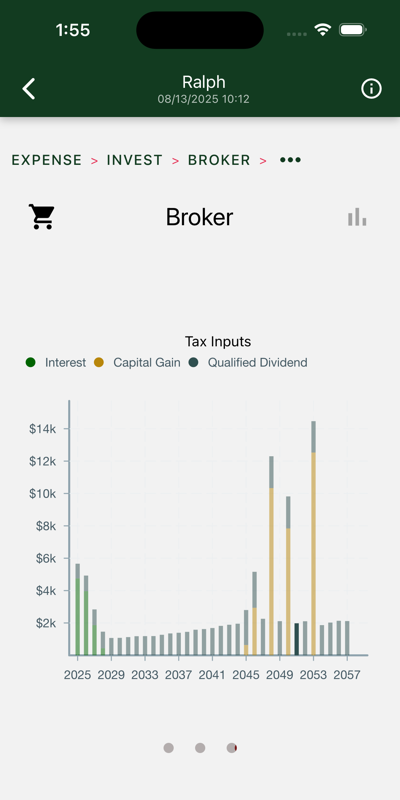
These numbers are entered on your tax return.
We can see:
- Bond coupons in the first couple years.
- S&P dividends over remaining years.
- Capital gains as S&P portion is tapped.
3.1.1.2 - IRA
This is the first year of one of your IRA accounts.
Here we see your assets deployed to ensure a steady stream of payments throughout your retirement. Of the starting balance, a big chunk goes to S&P. The remainder goes to build a ladder of TIPS bonds. These will drop a tranche of cash every year sufficient to anchor the cash leg of your hedged payment.
In later years, listed transactions might include:
- Cash draws
- S&P draws
- Cash rollovers to Roth
- S&P rollovers to Roth
Charts
Three charts are shown. Swipe to view each in turn.
Account Assets
Yearly total account balances, with cash and S&P assets highlighted. The black line shows your required minimum distribution, or RMD.
Here we see we took our starting balance and bought some bonds and S&P. The bonds are exhausted in a few years. The total balance trends down under pressure from yearly draws and Roth roll-overs. By 2048 most of your assets are in your broker or Roth account.
Taxable Draws
Withdrawals from your IRA account. These numbers are taxed as ordinary income. There are two ways to draw from an IRA:
- A regular distribution is included in your expenses for the year.
- IRA assets can also be “rolled over” to your Roth account. Pay your taxes on the withdrawal when you roll over, and later withdraw them tax-free from the Roth account. Hedgematic uses this strategy to smooth your tax rates over the entire course of your retirement.
Withdrawals and rollovers from cash and S&P are shown separately.
Untaxed Earnings
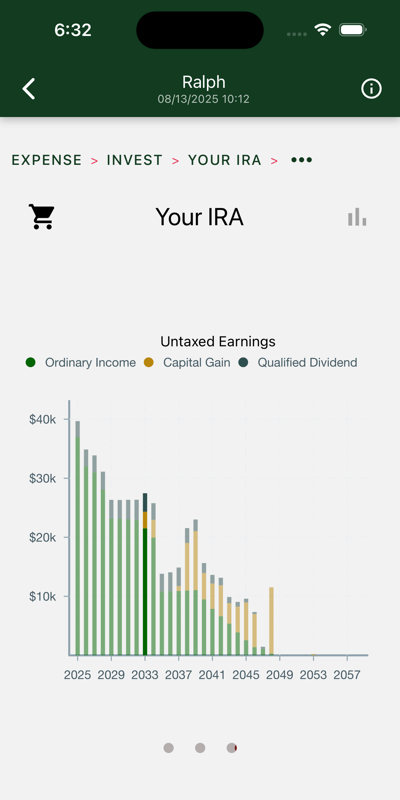
These numbers are for information only and not entered on your tax return. Regretably, they all show up as ordinary income when they are eventually drawn or rolled.
We can see:
- Bond coupons in the first couple years.
- Diminishing S&P dividends as the position shrinks.
- Capital gains as S&P portion is rolled.
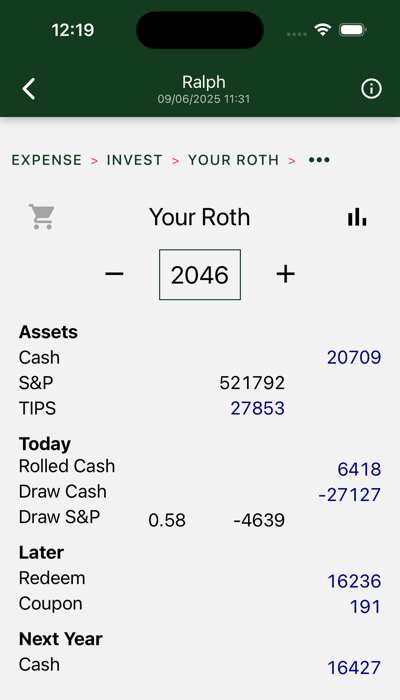
3.1.1.3 - Roth
This is one of your Roth accounts.
Shown are 2046 transactions. In this case, we take a cash and S&P rollovers from the IRA and draw cash. Later in the year a bond matures. This deposit will be directed to next year’s payout.
Charts
Three charts are shown. Swipe to view each in turn.
Account Assets
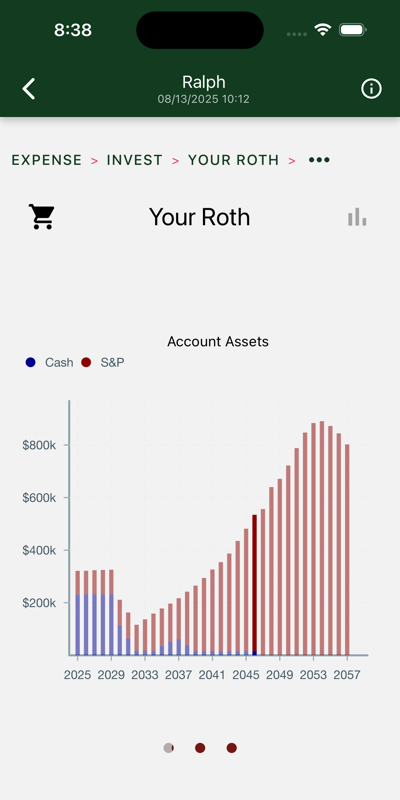
Yearly total account balances, with “cash” and S&P assets highlighted.
In this case, the bulk of the estate migrates to the Roth account as the IRA is drained.
Only after Ralph’s death and the attendant drop in Social Security payments does the balance stop climbing. Your heirs get the remaining $800K tax-free.
Account Activity
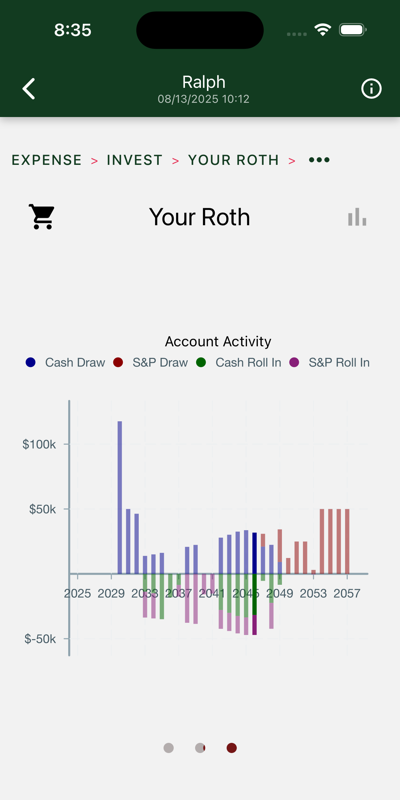
Withdrawals are on top. Roll-ins are on the bottom.
Withdrawals and roll-ins from “cash” and S&P accounts are shown separately.
Untaxed Earnings
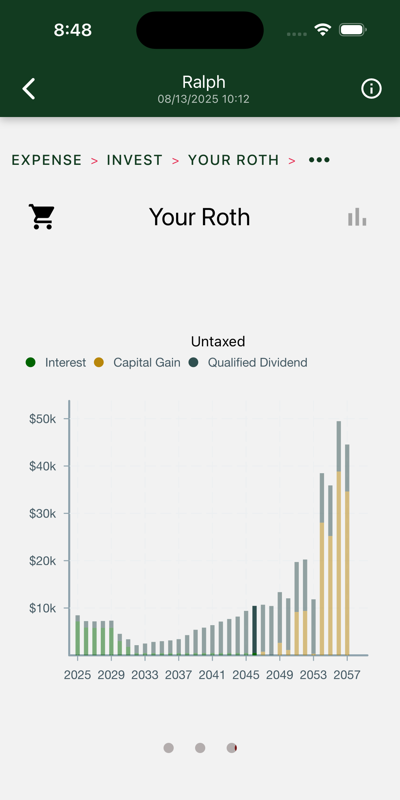
These numbers are shown solely for amusement purposes.
3.1.2 - Social Security
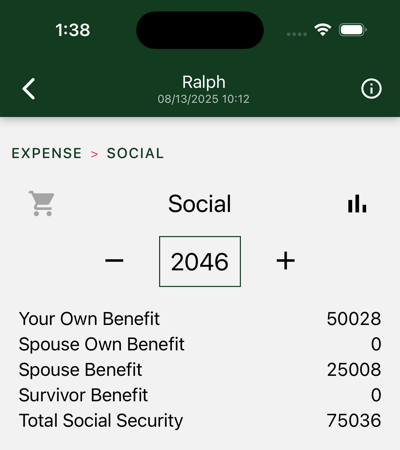
Total Social Security payments include:
- Your Social Security benefit.
- Your spouse’s Social Security benefit.
- Spouse benefit, if available.
- Survivor benefit, if available.
Social Security is computed from personal data in your profile.
Charts
One chart is shown.
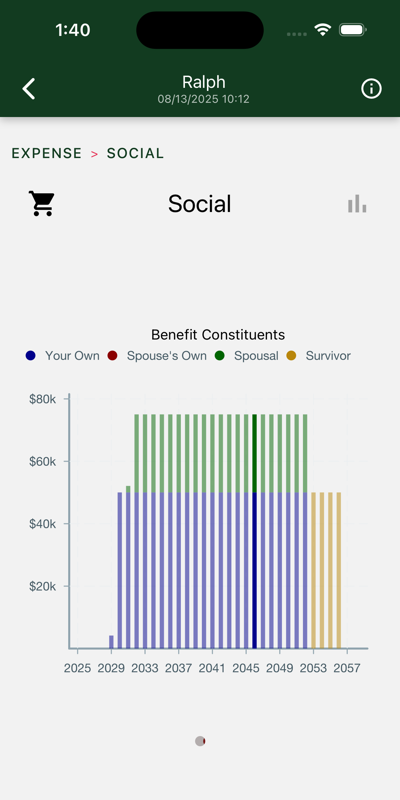
Illustrated is a two-earner couple. Ralph is male and two years older. He maxes out on social security. Margaret is female and hence lives two years longer than Ralph. Her work history was such that she opts for the spousal benefit. Ralph retires at age 64 and commences social security three years later at 67, his full retirement age. Margaret waits two more years before taking the spousal benefit at 67, her FRA. On Ralph’s death, she gets four years of survivor benefits.
3.1.3 - Taxes
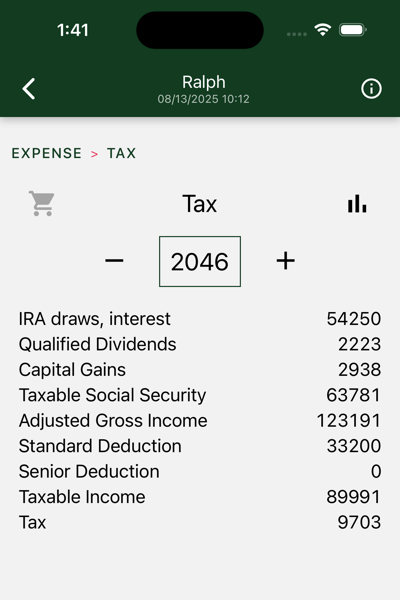
Hedgematic computes a tax return for each year of your retirement and includes the so-estimated taxes in your draw, over and above your required expenses. Displayed here is an estimated tax return.
Charts
One chart is displayed.
Tax Computation
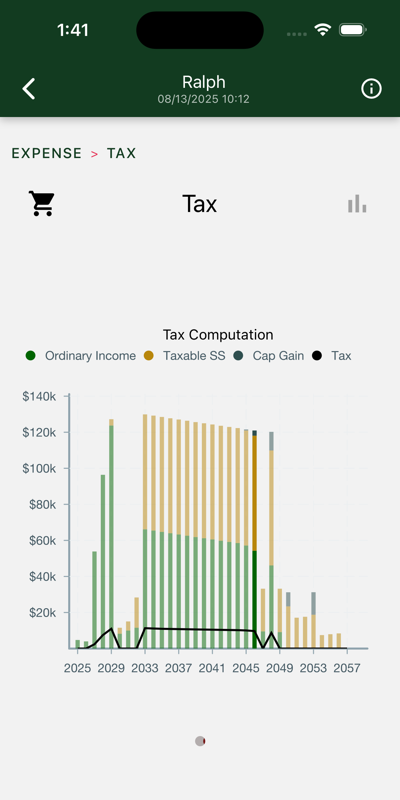
Bars represent entries on your 1040.
- Ordinary Income includes interest on bonds and withdrawals from your IRA.
- Taxable SS is that portion of Social Security subject to income taxes.
- Cap Gain includes reinvested (Qualified) S&P Dividends and gains on S&P sales.
The line at the bottom displays your total tax liability.
Note: Check out the smooth descent of the tax inputs in the middle of the chart. What is happening here is that Hedgematic is holding taxable income constant at the top of the 12% bracket. Taxable social security is not indexed for inflation. As it bites more, less room remains for IRA draws, which are consequently steadily decreased. The IRA is being systematically rolled to Roth without ever leaving the 12% bracket. By 2049, the IRA is zeroed out, the taxable social security plummets, and taxes go to zero.
3.2 - Asset Classess
Your after-tax, IRA, and Roth accounts each contain a mix of the following:
- S&P ETF
- TIPS Inflation Protected Bonds
- Cash
When you are ready to commit to a particular portfolio computation, you find your shopping list for year 0 under each account, with a page for each asset type.
3.2.1 - S&P
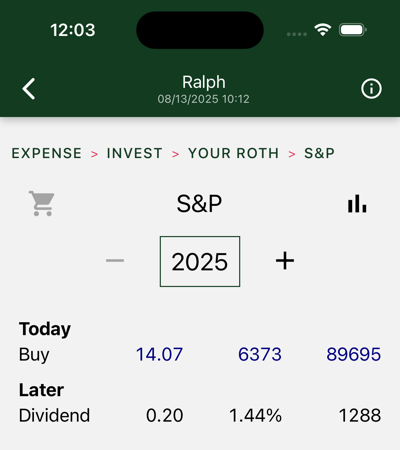
The S&P 500 is the oldest, most studied index of stock market performance. Hedgematic uses an S&P ETF to capture stock market income and gains. Your brokerage account and any retirement accounts each may have S&P holdings.
Hedgematic tracks S&P holdings in “S&P units”. Each unit is valued at the current S&P average. Your ETF will be priced differently. When you are directed to buy or sell so many units, multiply by the current S&P and divide by the current ETF to get the number of ETF shares to transact.
On day 0, inflation adjusted values and actual dollars are the same. In the first year, as displayed here, you have deployed all Roth assets to S&P.
Following the initial purchase, you are not directed to make any additional purchases, with the exception of reinvested dividends. (there are also in-kind rollovers). In effect, your S&P assets are split into individual tranches, each targeted at a particular year and “held to maturity.”
Hedgematic specifies S&P unit withdrawals for each year. You could just uninstall the app and follow the plan, withdrawing your yearly sums. More likely, you will look to rebalance each year.
The dollar figures shown in future years are estimates denominated in today’s dollars, so you should not expect them to match your future sale proceeds. Your proceeds, if you do back out future inflation, may come out higher or lower than the today’s dollar figures shown, which are modeled estimates. Navigate to the Lessons page to learn how this model is constructed and employed.
There is a chance that these proceeds may not meet your specified after-inflation expenses. You indicated your tolerance for this outcome with the risk aversity you included when you created your profile. But there will be a payday every year. Barring national catastrophe, you will not run out of money.
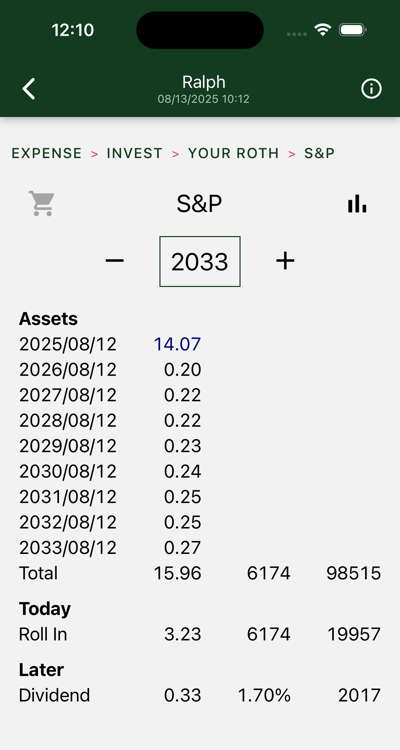
Above is an out-year display.
At the top of the screen, you see you are holding multiple lots of S&P. At the top is your original 14.07 S&Ps. Following you see reinvested dividends for nine years.
In 2033, you are instructed to roll 3.23 S&Ps from your IRA to this Roth.
In later years, you are instructed to sell part or all of particular tranches. Sale proceeds wind up in cash where they are drawn to support your year’s expenses.
Charts
Three charts are shown. Swipe to view each in turn.
Account Assets
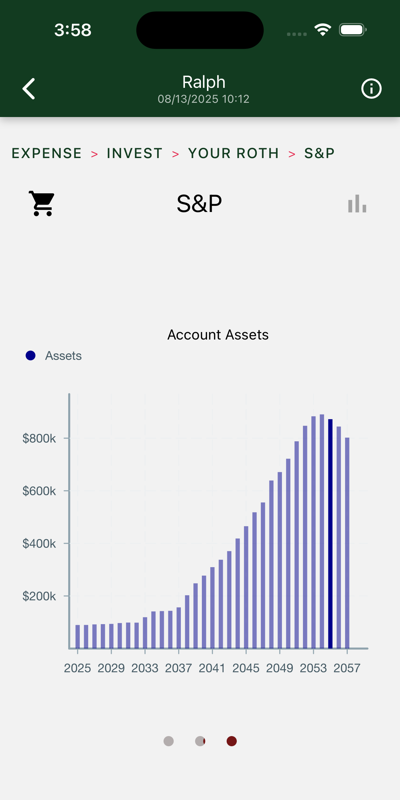
Yearly total account balances.
Account Activity
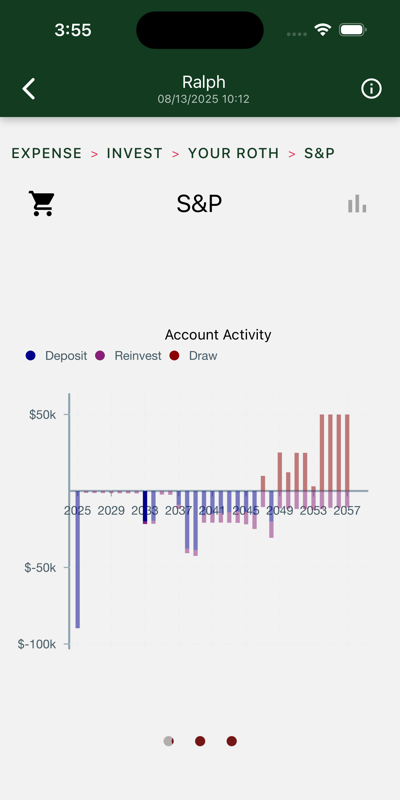
Withdrawals are on top. Initial purchases, reinvestments, and roll-ins are on the bottom.
Tax Inputs
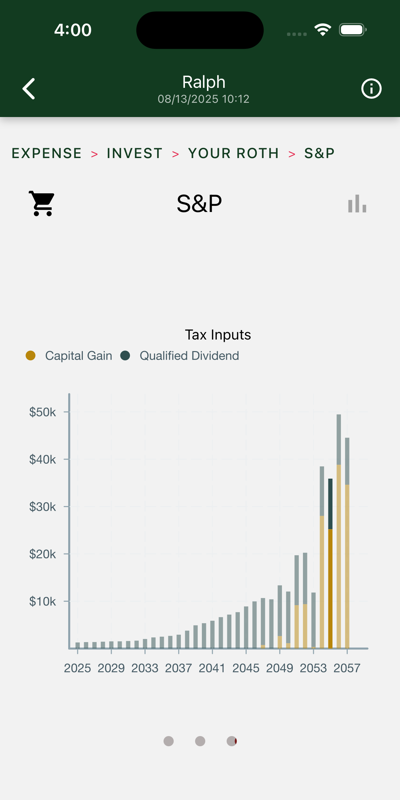
If we are in an after-tax account, these figures show up on your tax return. Otherwise, they are tax-free accumulations.
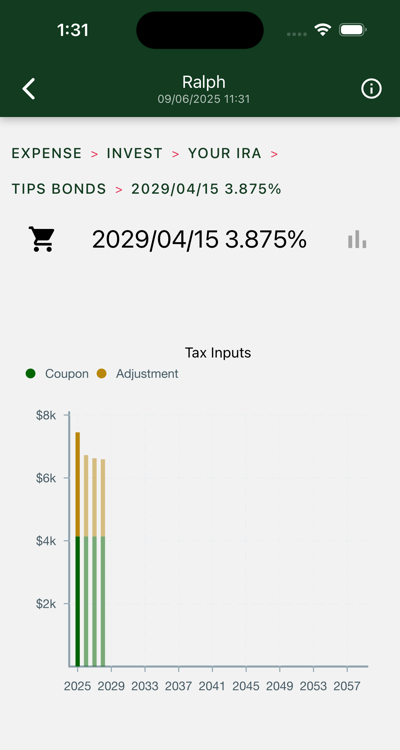
3.2.2 - TIPS Bonds
Hedgematic uses TIPS to to hold the inflation/market risk protected portion of your portfolio.
Bonds are purchased on day zero and held to maturity. We are not concerned about intervening volatility, as we are just purchasing a known current dollar sum as of the maturity date. Bond funds that mix maturity dates take on unnecessary market risk.
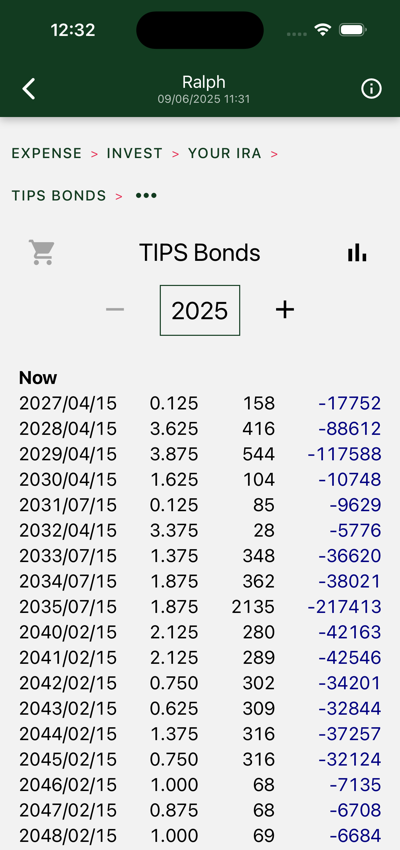
Displayed above is your day zero TIPS shopping list for your IRA account. You see a ladder of bonds, each of which are redeemed in separate years to give you the guaranteed portion of your yearly expenses. Note that as the term increases, the values decrease. In the out years we can rely more on the typically more profitable S&P to provide more income.
Your broker will list these bonds with treasury bills. The maturity date and coupon yield (in column 2) is used to identify the specific bond.
When issued, these bonds are denominated at $100 “par” value. The third column tells you how many individual bonds you will buy. Many brokers deal only in $1000/ten bond trades. If that is the case, divide the quantities by ten and enter the rounded count in your order.
Since they were issued, their principal value has been contiuously updated for inflation, so you no longer see 158 bonds worth $15800. Your purchase price reflects the additional coupon and redemption value of the bond. This multiplier is called the factor, and is reported along with other bond info.
Bonds will pay coupons twice a year. In after-tax accounts, coupons and an inflation adjustment are reported as income.
Bond income and redemptions are drawn from the account at the end of the year and applied to next year’s expenses.
Figures shown in following years are denominated in today’s dollars, and can be relied on with one exception; the inflation adjustment shown is only an estimate and has an effect only in after-tax accounts.
Drill down to see more information on individual bonds.
Charts
Three charts are shown. Swipe to view each in turn.
Bond Assets
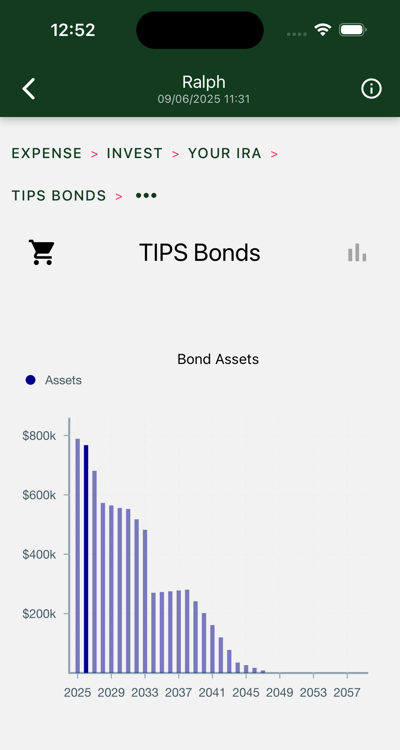
Total bond value decreases as earlier maturities are redeemed.
Bond Activity
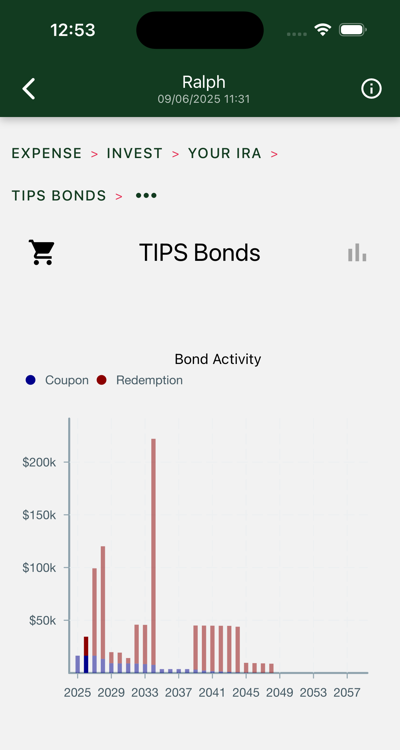
Tall bars are redemptions. Tiny bars are coupons.
Tax Inputs
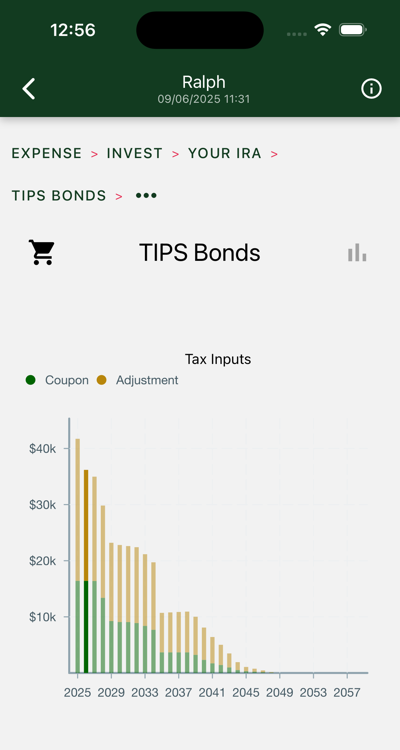
If we are in an after-tax account, these figures show up on your tax return. Otherwise, they document tax-free accumulations.
3.2.2.1 - TIPS Bond
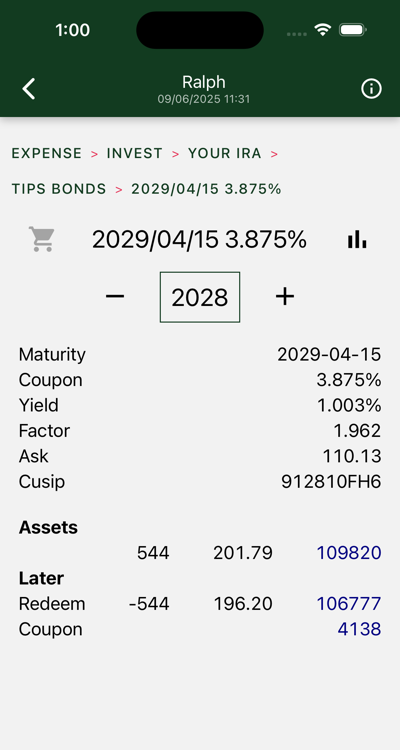
The information at the top of the page is commonly available when shopping for bonds.
- Maturity is the date you get your redemption and last coupon. The redemption amount is computed by multiplying the factor and the number of bonds.
- Coupon is paid twice a year. The coupon value is computed by multiplying the coupon rate and the factor and dividing by two. 3.875 * 1.962 / 2 = $3.80 for each bond, twice a year. 544 * $380 * 2 = the $4138 coupon value at the bottom of the page.
- Yield is the real yield, in constant dollars. Your bonds will earn both real yield and inflation adjustments.
- Factor tells you how much inflation has been added to this bond already. Here, the 1.962 tells you the bond, initially sold for $100, will be redeemed for almost $200 in current dollars, thanks to the power of compound inflation.
- The ask is provided you as if the bond was still $100. Multiply ask and factor to get what you will pay for this bond. In this case, it cost $216.07.
- The Cusip is an id you can use to search for a particular bond issue.
At the Broker’s
Visit your broker’s Treasury Bonds page. Locate the TIPS bonds.
Each issued bond has a maturity date and a coupon rate. Find the bond that matches the first two columns.
Buy the quantity shown in the third column. This is tricky. The amount you order is not the amount you pay.
- These bonds have a “par value” of $100. If you want 158 bonds, you order 158 times $100 or $15800 (depending on broker, likely rounded to the nearest thousand).
- The amount you pay, estimated in the fourth column, doesn’t match the order amount, and doesn’t match the figure in the fourth column. Your job is to turn the par value knob, and check whether the displayed cost amount is close.
The actual price of the bond is computed as the Factor times the Ask.
- The Factor accounts for the inflation adjustment applied since the bond was issued.
- The Ask responds to the Yield, and varies continuously throughout a session.
The amount you pay also includes adjustments to compensate the previous owner for their share of the next coupon.
Your broker will likely offer a ladder builder, where you can enter all the bonds you want first, then buy them in a single transaction.
Charts
Three charts are shown. Swipe to view each in turn.
Bond Assets
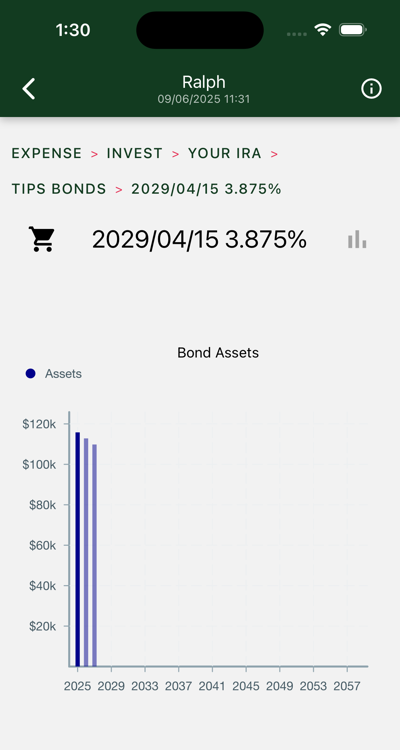
Present value of bond declines as coupons are paid out.
Bond Activity
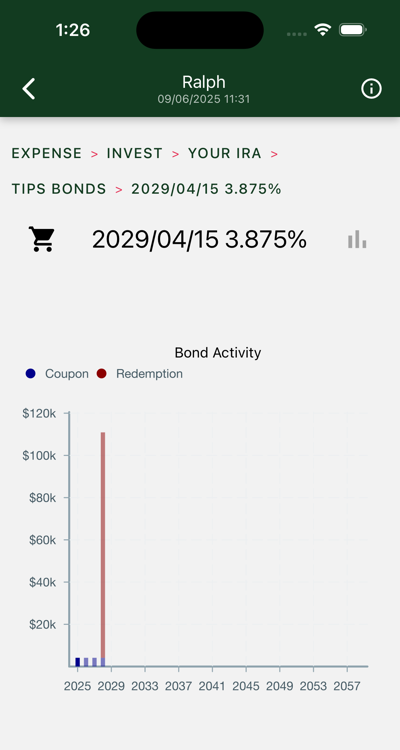
See small coupons followed by big redemption.
Tax Inputs
The coupons are in today’s dollars. Your adjustments will vary. If the bond is held in a broker account you will have to pay taxes on both coupons and adjustments. These adjustments are estimates from yield curve data of future inflation rates.
4 - The Hedgematic Portfolio
Hedgematic includes a collection of interactive tools to help explore the concepts behind the Hedgematic Portfolio. Visiting in order, you are guided from historical background, through creation of a single hedged position, to the complete portfolio with hedged payouts for each year of retirement.
4.1 - TRCAPE vs. Future S&P Returns
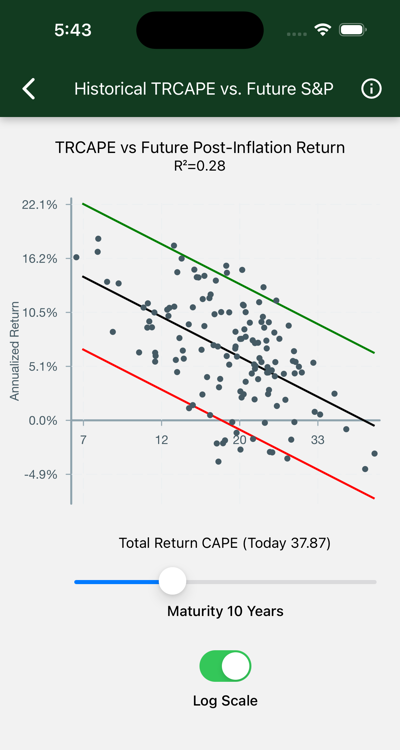
Is past performance any guide to future stock market returns? Efficient market theorists say “no,” but their claims are not universally supported. Robert J. Shiller, the Nobel Prize winning economist, explored this question in 1997, using data you see in this chart.
Data
Each dot on the chart represents a stock purchase made in one year.
TRCAPE appears on the x-axis. Computed from ten years of prior Standard and Poors 500 data, it is the ten-year average of individual Price/Return ratios, where Price is the inflation adjusted value of the S&P index, and Return is the annualized total real past ten-year return, including reinvested dividends, on the S&P investment. Consider it like a P/E ratio, smoothed over 10 years, and accounting for stock buybacks as well as just earnings. TRCAPE is historically high lately, suggesting that stocks are overvalued. Consult the background material below for how this statistic was developed and named.
Annualized Real S&P Return appears on the y-axis. This is the annualized total real return of an S&P investment, including reinvested dividends, over a given Term.
Term appears in the slider at the bottom of the page. This is the number of years the investment is held. As the term increases, returns draw closer to the historical rate of around six percent after inflation.
The black line is the best fit. Error bars capture about 95% of the data points. On the logarithmic scale the R-squared statistic is shown. This is interpreted as the percentage of variation accounted for by TRCAPE. An R-squared of zero would appear with a horizontal line, indicating no effect; if R-Squared were 1.0, we would see a perfect fit, with all the dots on the black line.
Interpretation
Big TRCAPE bad; little TRCAPE good. At any maturity:
- With low values of TRCAPE, on the left side of the chart, returns are high, indicating undervalued stocks.
- With high TRCAPE values, real returns drop, indicating overvalued stocks. The chart shows TRCAPE at 37.87. Note that all the dots on the extreme right of the illustrated chart fall below zero.
The quality of our predictions depends on the maturity we are looking at.
- The illustrated chart shows results for ten year maturities. R-squared is 21%
- If you move the maturity slider all the way left for a maturity of one year, R-squared drops to .04 and returns are all over the map, confirming that returns are basically useless for predicting future returns at short maturities.
- Move the maturity slider to 30 years. R-Squared goes to .21 and the dots are all well above zero. We are seeing the market returning to its historical real earnings of about 6%. The effect of our current conditions will be little felt thirty years from now.
Background
Shiller’s analysis is encapsulated in Valuation Ratios and the Long-Run Stock Market Outlook Shiller and his co-author, John Campbell, presented his findings to the Federal Reserve Board of Governers December 3, 1996.
In Shillers presentation, he described a statistic he called the “cyclically adjusted price-to-earnings ratio”, abbreviated “CAPE”, “CAPE10”, or “Shiller P/E”. This statistic is computed as the average P/R is described here, except that earnings appear in the denominator instead of total return. This statistic is available daily on financial sites.
As corporations incorporated stock buybacks into their strategies, investors sought a measure that incorporated total return. Shiller responded in 2018 by publishing a “total return CAPE”, or TRCAPE, the measure Hedgematic uses.
Shillers’ publicly accessible papers are linked at Home Page of Robert J. Shiller.
The data displayed on this page is sourced from ie_data.xls, which is linked from Shiller Data.
4.2 - TRCAPE and Reinvested S&P Earnings
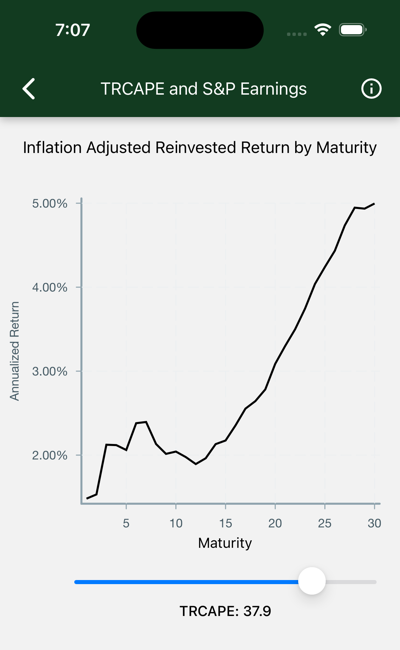
What do we see if we model TRCAPE’s effect on future on future reinvested inflation-adjusted S&P returns?
Data
Each point on the black line represents the expected annualized real S&P return on a purchase held for a given term. The slider updates the chart for different values of TRCAPE at purchase time.
Maturity appears on the x-axis. This is the number of years an S&P investment is held. As the term increases, returns draw closer to the historical rate of around six percent after inflation.
Annualized Real S&P Return appears on the y-axis. This is the expected annualized total after-inflation return of an S&P investment, including reinvested dividends, given a Term and TRCAPE.
TRCAPE is adjusted with the slider.
Interpretation
The chart is initially displayed for today’s TRCAPE. Look on the y-axis to find your expected annualized return for 30 maturities.
- Move the slider to the left to explore the historical effect of low TRCAPE values. In the short term, returns are higher than long-term values. Long returns approach historical long-term results.
- Move the slider to the right to explore the historical effect of high TRCAPE values. In the illustrated case, we see real returns hovering around 2% until some 15 years has passed. These returns might be higher than those available on TIPS bonds, but not by enough to mitigate the additional risk imposed by stock market volatility.
4.3 - TRCAPE and S&P Price
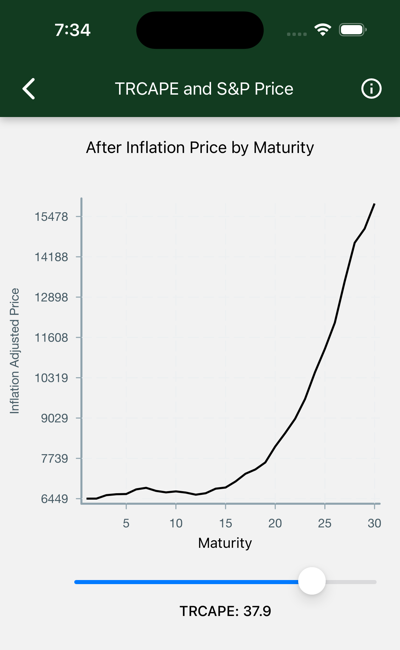
What do we see if we model TRCAPE’s effect on future inflation-adjusted S&P prices?
Data
Each point on the black line represents the expected real S&P price at the conclusion of that term. The slider updates the chart for different values of TRCAPE at purchase time.
Maturity appears on the x-axis. This is the number of years an S&P investment is held.
Real S&P Price appears on the y-axis. This is the expected todays-dollar value of the S&P index, given a Term and TRCAPE.
TRCAPE is adjusted with the slider.
Interpretation
The chart is initially displayed for today’s TRCAPE. If you bought the S&P today and held it for a particular term, look on the y-axis to find your expected current-dollar S&P index at the end of your term.
- Move the slider to the left to explore the historical effect of low TRCAPE values.
- In the short term, low values of TRCAPE historically are associated with a steady increase in the S&P index.
- Move the slider to the right to explore the historical effect of high TRCAPE values.
- The index is flat for the first few years, indicating an S&P that just keeps up with inflation.
In the illustrated case, we see current dollar prices basically flat until some 15 years has passed. The nominal price will appear to go up, but those gains are not enough to compensate for expected inflation and the real yield available on inflation adjusted instruments.
4.4 - S&P Earnings Volatility
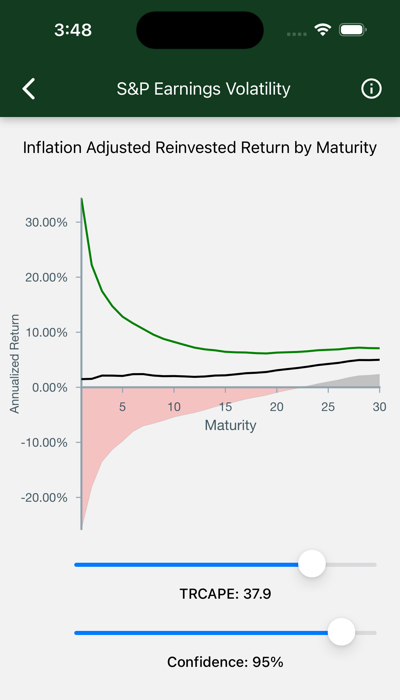
What if we show confidence intervals around modeled S&P Returns?
Data
The chart shows real annualized return by term, given TRCAPE. A slider allows you to set a percentage, called “confidence”. If confidence is 95%, the high and low lines are drawn to include 95% of the expected possibile outcomes. The red zone includes those cases where you lose money. The dark zone shows you where you might be 95% confident that no loss will occur.
Maturity appears on the x-axis. This is the number of years an S&P investment is held. As the term increases, you can be more confident that your return falls closeer to the predicted value.
Annualized Return appears on the y-axis. This is the expected annualized total after-inflation return of an S&P investment, including reinvested dividends, given a Term and TRCAPE.
TRCAPE is adjusted with the slider.
Confidence is the confidence percentage. It measures your risk tolerance, with lower values indicating increased tolerance, and higher values indicating relative risk averseness.
Interpretation
- Check out the Maturity effect:
- Short-term bets have wildly varying potential outcomes.
- Long-term investments give you comparatively less risk.
- The chart is initially displayed for today’s TRCAPE. Adjust it and watch:
- If TRCAPE is low, historically, you get out of the red zone much more quickly.
- If TRCAPE is high, you might go 20 years before you reach a tolerable capital loss risk.
- The bottom slider adjusts confidence.
- Move it higher to decrease your chance of unexpected capital loss.
- But keep in mind that unexpected capital gains are also being trimmed.
4.5 - US Treasury Inflation Protected Bonds
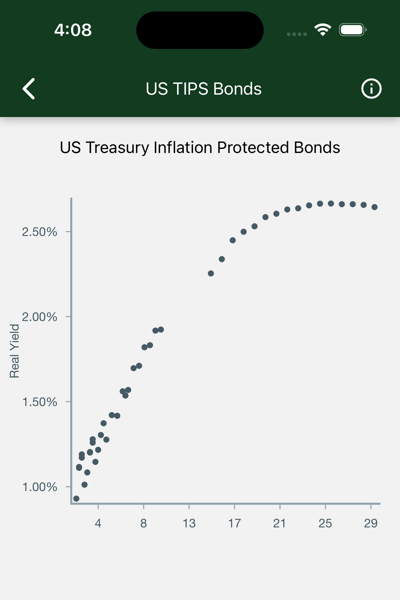
Is there an investment I can have 100% confidence in? No, but there is one that gets close.
TIPS (Treasury Inflation Protected Securities) Bonds promise inflation-protected yields, guaranteed by the US government. There are caveats:
- Real yields are low, though competitive after inflation.
- Inflation adjustments are taxed as income.
- You are assuming the US government will continue to pay its bills.
Data
One dot represents an outstanding TIPS bond that matures in a given term. The y-axis displays the current real yield of each issue.
Maturity appears on the x-axis. This is the years to maturity of the bond.
Real Yield appears on the y-axis. The inflation-protected yield. If the real yield is shown as 1.0% and inflation is 2%, compare to a bank account paying 3% on savings.
Discussion
There is a gap of several years where no TIPS are available. These bonds are issued more frequently with more maturities, so that gap will fill in over the next few years.
It is possible to build a completely (with the exception of Treasury default) hedged portfolio consisting solely of TIPS bonds. This comes at great cost though, as you would give up any stock market returns, which have historically outpaced these securities. Where TIPS bonds come into their own though, is as the foundation of a hedged portfolio. By mixing TIPS bonds and stock market instruments, you can create a portfolio that provides a yield, commensurate with your risk tolerance, between that of market returns and the solid floor provided by the TIPS bond.
4.6 - Hedge with a TIPS/S&P Mix
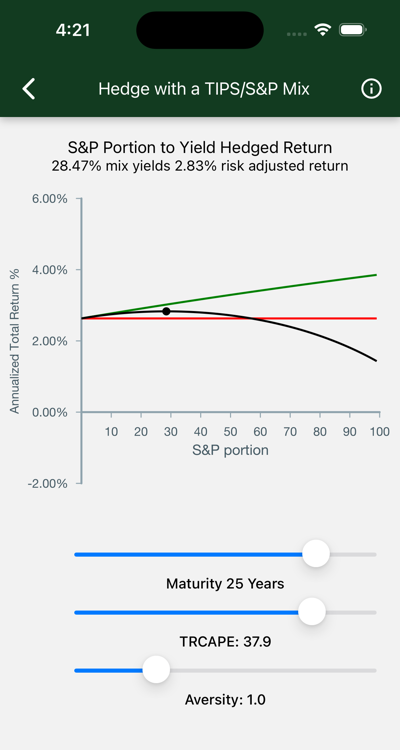
Suppose you are plotting an investment to mature in ten years. How do you structure it to keep your risk constant, even though future expected S&P returns will vary from year to year? Vary the proportion of S&P and TIPS holdings.
Data
The chart shows expected annualized total after-inflation return of a fixed-term S&P/TIPS mix, with S&P content ranging from 0 to 100%. Use the sliders to see the effect of changes in starting assumptions: term, aversity, and TR CAPE.
Annualized Total Return % appears on the y-axis. This is the expected annualized total after-inflation return of an S&P/TIPS mix.
S&P Portion appears on the x-axis. This is the percentage of an S&P/TIPS mix which is placed in the S&P, with the remainder in TIPS bonds.
Expected S&P return is shown by the top (green) line. It tops out at the expected return of a 100% S&P portfolio.
TIPS yield is the horizontal (red) line. It shows the return on a TIPS investment with the selected maturity.
Risk Adjusted Return This line (black) charts the risk adjusted return for mixtures of between 0 and 100%. The dot marks its maximum.
Maturity is the term of your hybrid investment.
Aversity 1 is the default. A value of .5 has the effect of hedging against loss rather than achieving the maximum risk adjusted return. Lesser values indicate you are willing to chance a loss to get closer to that green line. Aversity of 0 puts all your savings in the market. YOLO. Numbers higher than 1 will increase the cash contribution.
TRCAPE will have an effect on these predictions.
Interpretation
- The S&P portion rises as maturity lengthens.
- Short-term S&P volatility dominates. If you want your money back in a year you will not put it in the market.
- Long-term, it is very unlikely that the S&P will not beat TIPS. The lines never cross. A 100% allocation is called for.
- Trade increased returns for higher risk using the aversity slider.
- Even at large values for aversity you are going to include S%P in your portfolio as maturities lengthen.
- Current valuations, measured by TR CAPE, have historically had a noticeable effect on performance, and hence, on these predictions. See this effect by trying high and low TR CAPE values.
Using this tool you can essentially design a custom instrument that pays off after a fixed term, with risk and return balanced to your preference. Buy it and hold it long, without attending to daily ups and downs in the market.
The illustrated chart says with a TRCAPE of 37.9 and a maturity of 25 years, you can secure a risk-adjusted real return of 2.83% by adding 28.47% S&P to your year-25 withdrawal. The remaining portion will come from Social Security and TIPS bonds.
4.7 - Combine Yearly Instruments
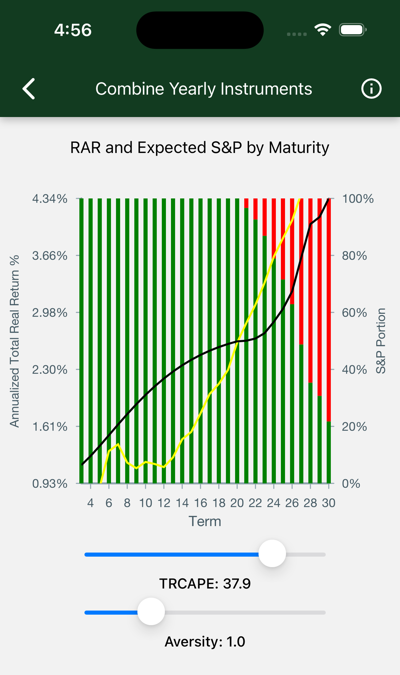
How do I design a portfolio that covers the length of my retirement?
We have seen (on the previous page) how to construct a combination of S&P and TIPS bonds that yield (with allowance for risk aversity) an optimum inflation-adjusted payout for a single fixed term. Now, the only remaining job is to construct such an instrument for each year of our retirement, and combine them in a single portfolio.
Data
The chart shows expected annualized total after-inflation return of a fixed-term S&P/TIPS mix, with S&P content ranging from 0 to 100%. Use the sliders to see the effect of changes in starting assumptions: aversity, and TRCAPE.
Annualized Total Real Return appears on the left y-axis. Use it to find values for the two lines on the chart. The black line is the risk-adjusted return of your portfolio. The yellow line shows the expected real S&P return. If the black line is under the yellow line, you are all cash. Once they cross, we start adding some S&P and the risk-adjusted yield starts rising more steeply.
Tips Portion marks the right-side y-axis. Use it to guage the height of the left (green) bars, which tell you what percentage of TIPS goes into each year’s payment. The red area is the S&P portion for each year’s withdrawal.
Term is listed on the x-axis. See the yearly portfolio composition for each year, as well as its resulting return.
TRCAPE will have an effect on these predictions. Higher values result in more TIPS.
Aversity 1.0 is the default.
Interpretation
For each year, the bars show the portion of draws that come from market assets, on the top, and inflation-adjusted bonds, on the bottom. For out-years, your portfolio will approach 100% stock.
- The aversity slider changes the composition of your portfolio, as well as the gains for early years.
- Move it right to increase the cash holdings, left to decrease.
- TRCAPE can be adjusted to see how the portfolio would be adjusted for different current market valuations.
With this design, you have determined the source of your yearly draw.
The next step is to add your yearly expenses and assets, then assign draws to accounts to secure a tax-advantaged result. Your final result: Your Hedgematic portfolio.
5 - More Info
5.1 - Privacy
Your email address is required to create an account with Hedgematic, and to recover from lost passwords, etc.
As a hedgematic user, you enter hypothetical personal and financial scenarios, then direct Hedgematic to compute an estimate of future income and assets. This hypothetical information includes birthdate, sex, marital status, your relative life expectency, tolerance for income shortfalls, expected social security benefits, required yearly expenses, and current balances in personal and retirement accounts. These hypotheticals are saved on our servers, associated with your account number.
Information we collect is kept confidential, and not shared with partners, or sold to other firms or enterprises.
The app offers you the ability to:
- Delete any indvidual scenario.
- Delete all of your scenarios.
- Delete your account.
Once a scenario is deleted, it is erased from our servers. It may remain saved, in the form of backups or logs, for a limited time.
If you delete your account, your scenarios, results, and email address are deleted, and any connection between your email address and information on our servers is severed, leaving any residual information we continue to possess untraceable to you.
5.2 - Contacts
Send feedback and issues to feedback@hedgematic.com
Direct press inquiries to inquiries@hedgematic.com