What if we show confidence intervals around modeled S&P Returns?
Data
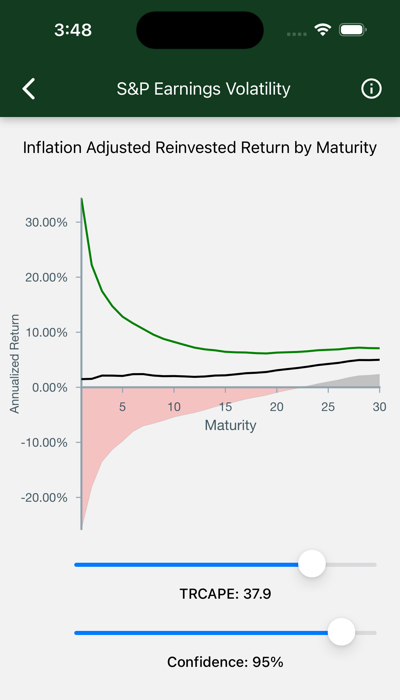
The chart shows real annualized return by term, given TRCAPE. A slider allows you to set a percentage, called “confidence”. If confidence is 95%, the high and low lines are drawn to include 95% of the expected possibile outcomes. The red zone includes those cases where you lose money. The dark zone shows you where you might be 95% confident that no loss will occur.
Maturity appears on the x-axis. This is the number of years an S&P investment is held. As the term increases, you can be more confident that your return falls closeer to the predicted value.
Annualized Return appears on the y-axis. This is the expected annualized total after-inflation return of an S&P investment, including reinvested dividends, given a Term and TRCAPE.
TRCAPE is adjusted with the slider.
Confidence is the confidence percentage. It measures your risk tolerance, with lower values indicating increased tolerance, and higher values indicating relative risk averseness.
Interpretation
- Check out the Maturity effect:
- Short-term bets have wildly varying potential outcomes.
- Long-term investments give you comparatively less risk.
- The chart is initially displayed for today’s TRCAPE. Adjust it and watch:
- If TRCAPE is low, historically, you get out of the red zone much more quickly.
- If TRCAPE is high, you might go 20 years before you reach a tolerable capital loss risk.
- The bottom slider adjusts confidence.
- Move it higher to decrease your chance of unexpected capital loss.
- But keep in mind that unexpected capital gains are also being trimmed.