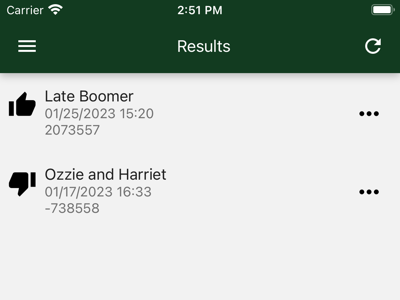
Every time you compute results for one of your profiles a row is added to this list.
Each entry includes the name of the profile, the date it was computed, and the over/short dollars.
Thumbs up means all your expenses are covered; the dollar figure is your estate.
Thumbs down means you have to add money or reduce expectations before commencing your life of leisure.
Tap the row to display the results of one computation.
The dot menu allows you to delete the result (leaving the profile untouched).
1 - Expenses
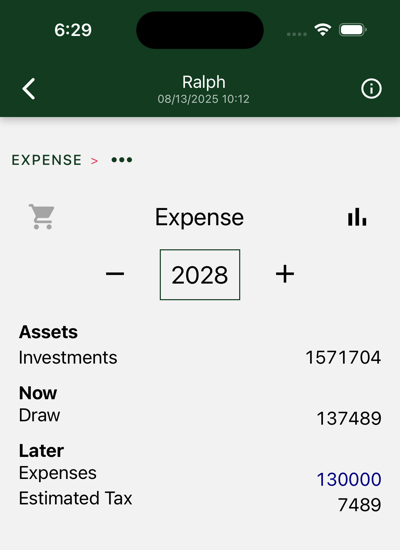
Commence result navigation with Expenses
This is the first result screen you will see. Did you make your expenses. Are you over? Where are you short?
This, and succeeding screens, share navigation features.
At each level, you can select the cart view or the chart view. Illustrated is the cart view. The cart view is where you find listed the actions you take today and on succeeding yearly anniverseries, as well as asset summaries and anticipated transactions over the course of the remainder of the year.
Get the numbers for each year by changing the year.
The breadcrumb at the top of the page lets you drill down on result details and pop back up.
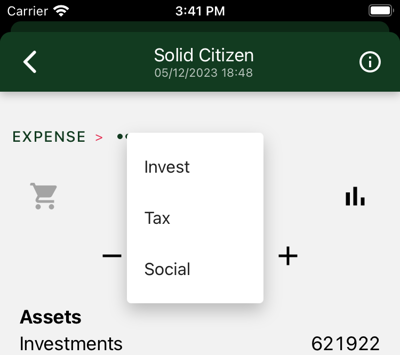
Tap the dots to select drill-down options. Here we have Investment, Tax, and Social.
The back arrow returns you to the result list. Return to the top level by tapping EXPENSE in the breadcrumb.
Charts
Tap the chart icon to see charts for each level.
Usually, multiple charts are available. Swipe to view each in turn.
Tap inside the chart to change the cart view display year.
Tap the cart view icon to switch back to cart view.
At this level three charts are available.
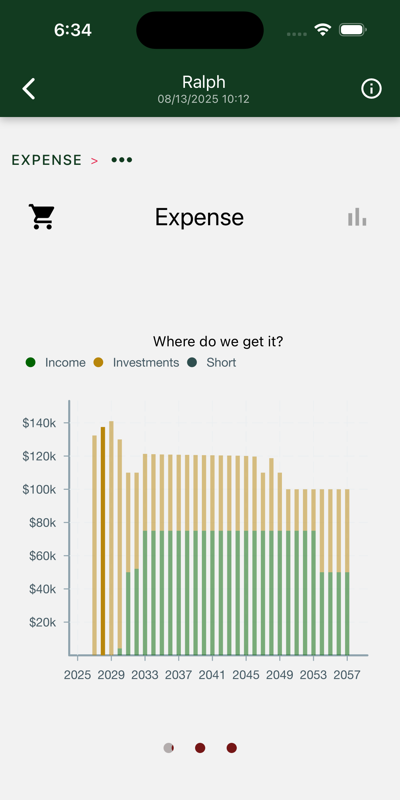
Where do we get it?
Data is displayed for the duration of your retirement. In this case we see retirement starts in two years.
Bars represent the actual payments from investments or cash income and, if applicable, any shortfall between that income and your required expenses. Cover the shortfalls and you are ready to commence retirement.
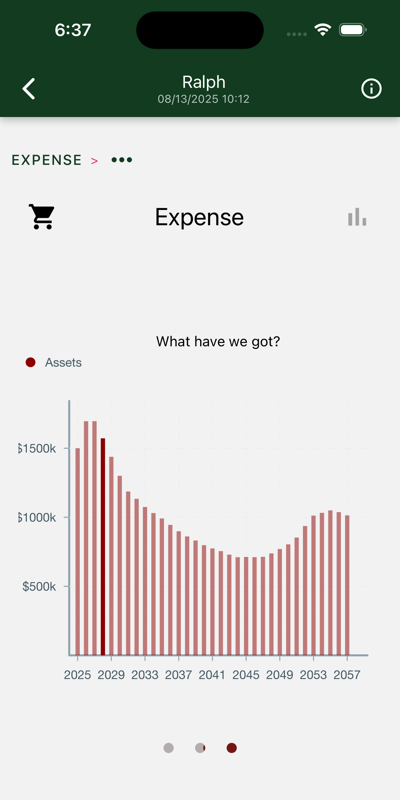
What have we got?
Shows total balance over years in your investment accounts. In this case we see assets diminishing until Social Security really kicks in. After many comfortable years, Ralph dies, and the Mrs., on reduced payments, starts to draw down the balance, eventually leaving a million to her heirs.
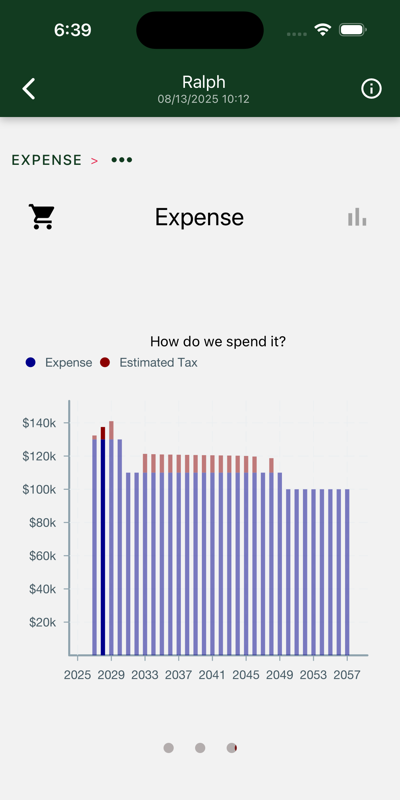
How do we spend it?
Your expenses are your desired current-dollar, after-tax expenses, plus estimated taxes you need to pay. Note that you never paid more than $11K in taxes.
1.1 - Investments
Drill down on investments
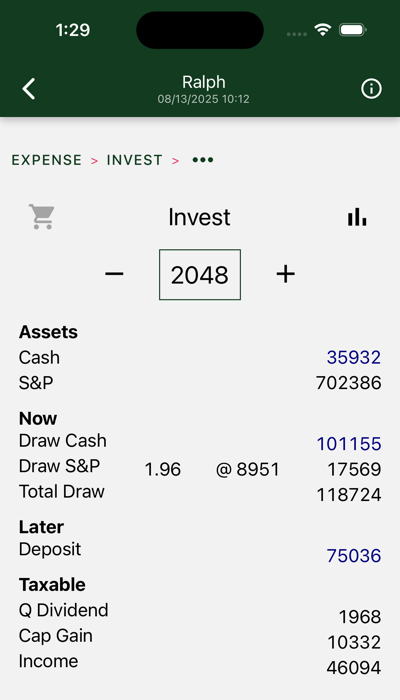
Your assets are divided between after-tax and retirement accounts. Within each account, assets may be held in “cash,” including inflation-protected bonds, or S&P index instruments.
In this year, we draw cash and S&P. Cash draws are denominated in current dollars. The blue font is used to distinguish actual current dollar figures from modeled estimates of market performance. The S&P withdrawal is denominated in S&P units, or multiples of the S&P average (predicted to be $8951 in 2048). It will vary depending on market performance. Note that, given current valuations, we are depending on the market for only 15% of our 2048 income.
The draw includes $110K of after-tax expenses and an estimated $8724 tax payment.
Figures at the bottom show tax inputs from your before-tax account and traditional IRA(s).
Charts
Four charts are shown. Swipe to view each in turn.
Drill down further in results to see similar charts for each separate account. Charts on this page show totals across all of your accounts.
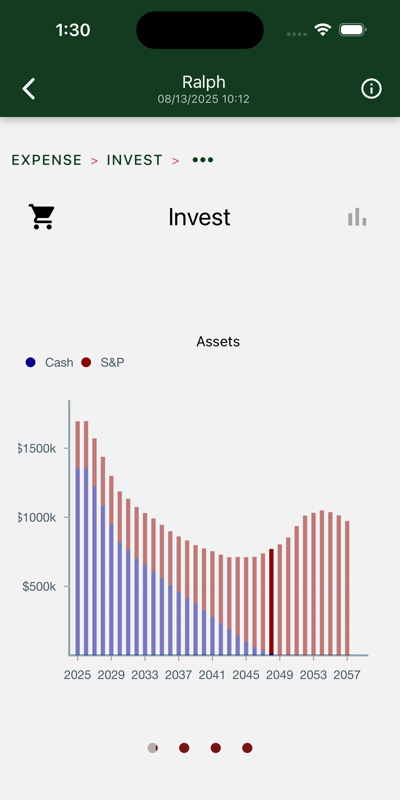
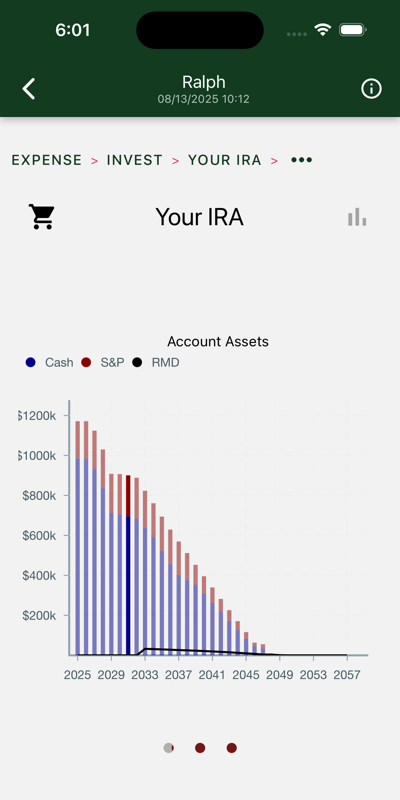
Assets
Yearly total account balances, with “cash” and S&P assets highlighted. Cash assets are reserved for the early years, when stock market volatility poses the greatest risk and you don’t have social security to anchor your hedge.
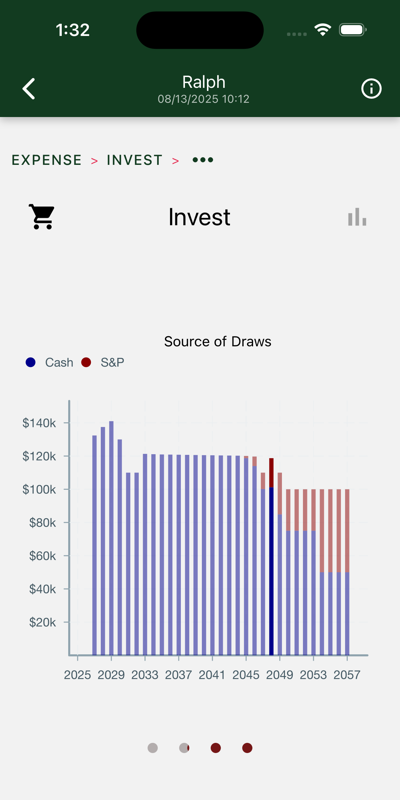
Source of draws
Withdrawals from your investment accounts. Cash assets are consumed first, until the higher expected returns of the stock market catch up to and overtake their expected risk.
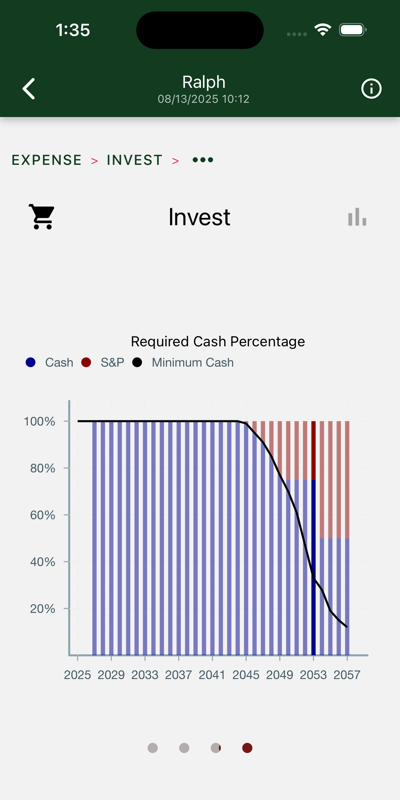
Required cash percentage
The bars show the percentage of cash assets in each year’s draw. The line shows the required percentage. The bars and line diverge when social security is suffiecient to cover the cash portion of your hedge.
These percentages vary greatly depending on a ten-year moving average of market valuations. The 2023 version of this chart has you all in on stock by 2043.
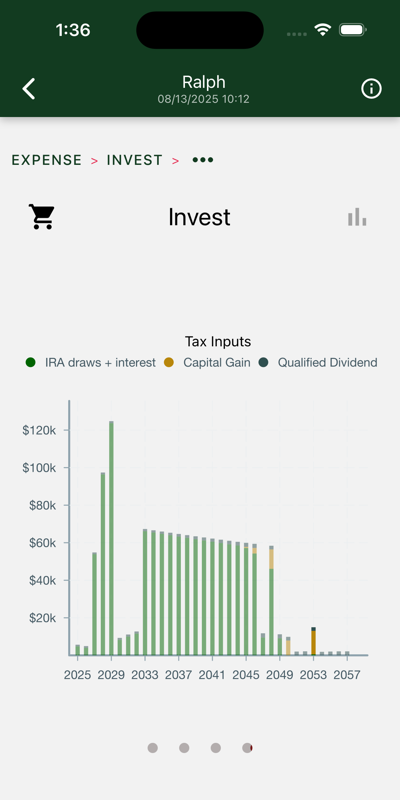
Tax inputs
These numbers are entered on your tax return. They come from two sources:
After tax account:
Ordinary income from bond interest.
Imputed ordinary income from bond inflation adjustments
Qualified dividends from S&P ETFs. These are reinvested.
Capital gain on S&P draws.
Traditional IRAs
Withdrawals are taxed as ordinary income.
Rollovers to Roth accounts are also treated as ordinary income.
In this case, IRA draws are the biggest contributor.
1.1.1 - Broker
After-tax account
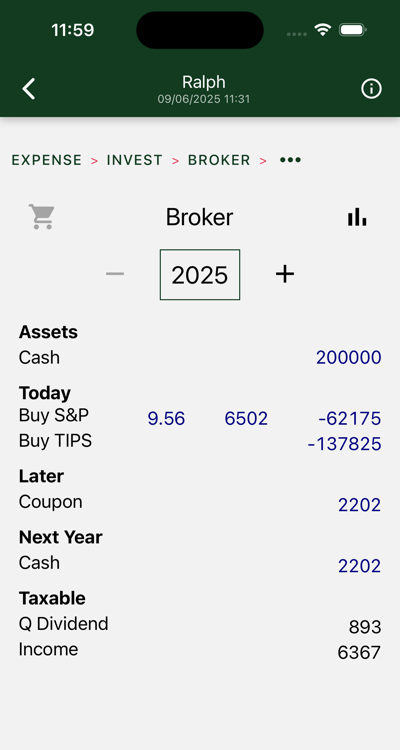
This is your “broker” or after-tax account.
Required actions are shown for each year. Drill down to see details. The illustration shows the transactions used to set up the portfolio in the first year, in this case, an S&P purchase, and a ladder of TIPS bonds that mature over the first years of the portfolio.
Bond and social security income accrues over the remainder of the year. It is carried over to the next year, where it is typically pulled with the cash draw. (On those occasions where it is not, inflation is charged.)
Charts
Three charts are shown. Swipe to view each in turn.
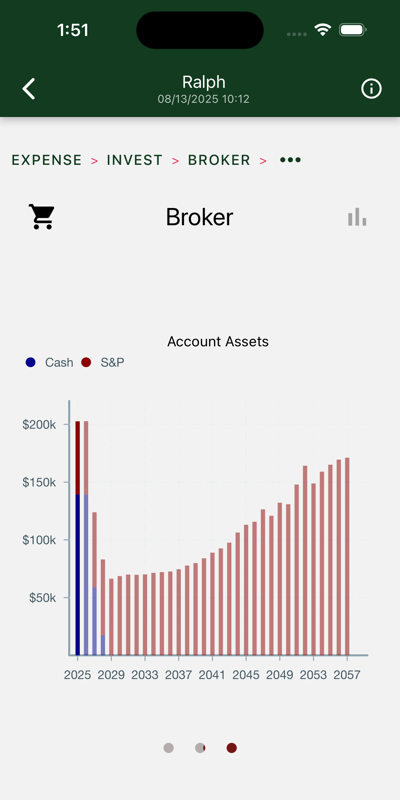
Account Assets
Yearly total account balances, with “cash” and S&P assets highlighted.
Here we see we took our cash and bought some bonds and S&P. The bonds are gone pretty quick. The stock is held to the last years of retirement, when the IRA is gone and the capital gains can be drawn tax free. $150K goes to heirs.
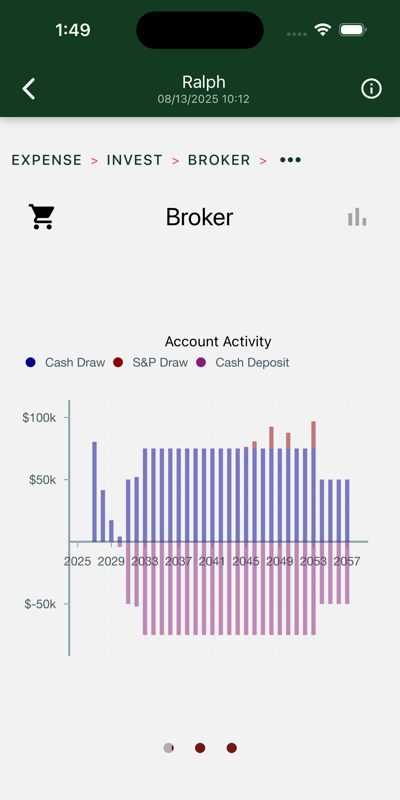
Account Activity
In this chart, we see an initial set of withdrawals used to support us for the first three years. On the right side of the chart we mostly see social security deposits being deposited, then withdrawn to support the succeeding year.
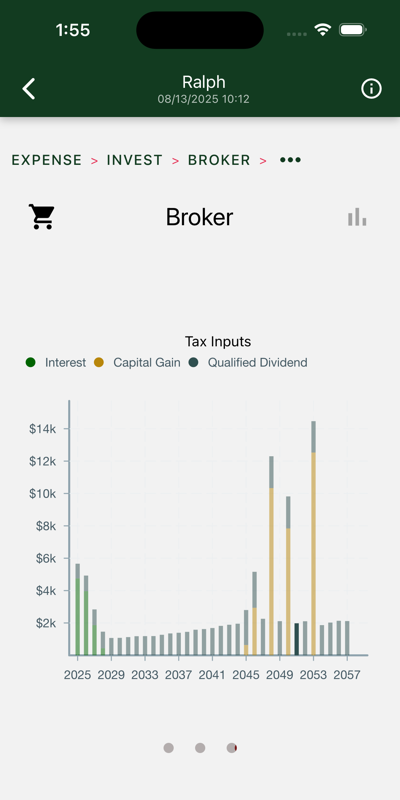
Tax inputs
These numbers are entered on your tax return.
We can see:
Bond coupons in the first couple years.
S&P dividends over remaining years.
Capital gains as S&P portion is tapped.
1.1.2 - IRA
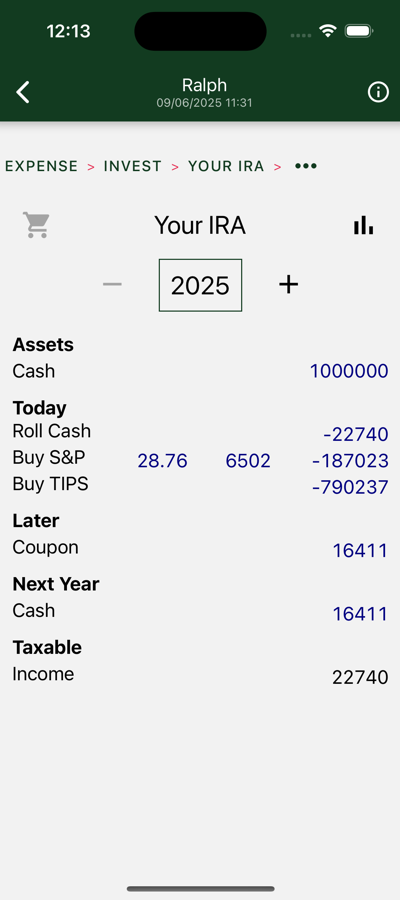
IRA balances and transactions
This is the first year of one of your IRA accounts.
Here we see your assets deployed to ensure a steady stream of payments throughout your retirement. Of the starting balance, a big chunk goes to S&P. The remainder goes to build a ladder of TIPS bonds. These will drop a tranche of cash every year sufficient to anchor the cash leg of your hedged payment.
In later years, listed transactions might include:
Cash draws
S&P draws
Cash rollovers to Roth
S&P rollovers to Roth
Charts
Three charts are shown. Swipe to view each in turn.
Account Assets
Yearly total account balances, with cash and S&P assets highlighted. The black line shows your required minimum distribution, or RMD.
Here we see we took our starting balance and bought some bonds and S&P. The bonds are exhausted in a few years. The total balance trends down under pressure from yearly draws and Roth roll-overs. By 2048 most of your assets are in your broker or Roth account.
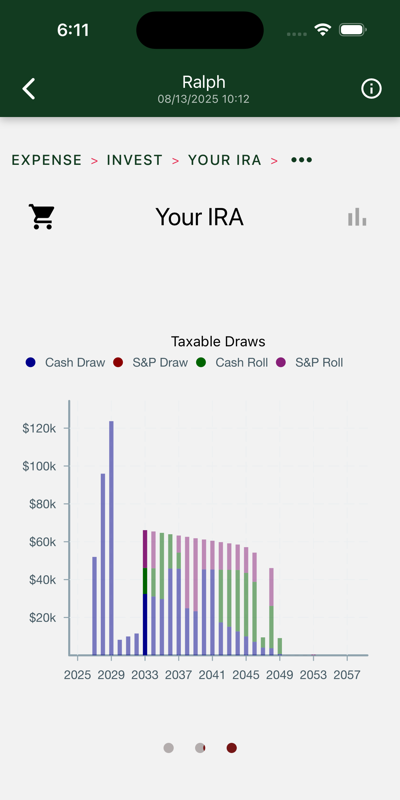
Taxable Draws
Withdrawals from your IRA account. These numbers are taxed as ordinary income. There are two ways to draw from an IRA:
A regular distribution is included in your expenses for the year.
IRA assets can also be “rolled over” to your Roth account. Pay your taxes on the withdrawal when you roll over, and later withdraw them tax-free from the Roth account. Hedgematic uses this strategy to smooth your tax rates over the entire course of your retirement.
Withdrawals and rollovers from cash and S&P are shown separately.
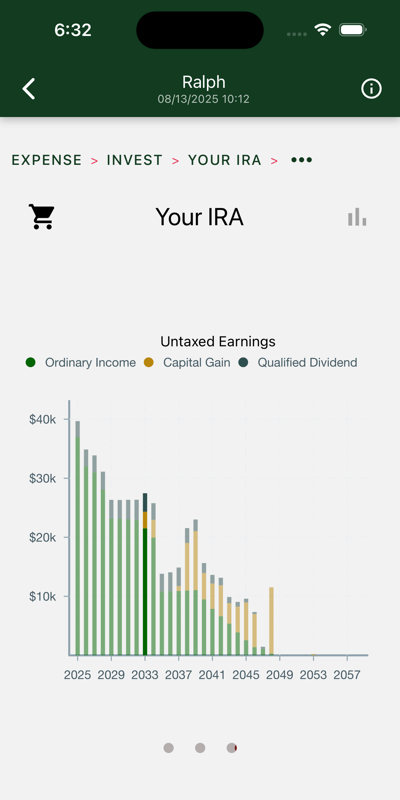
Untaxed Earnings
These numbers are for information only and not entered on your tax return. Regretably, they all show up as ordinary income when they are eventually drawn or rolled.
We can see:
Bond coupons in the first couple years.
Diminishing S&P dividends as the position shrinks.
Capital gains as S&P portion is rolled.
1.1.3 - Roth
Roth account balances and transactions
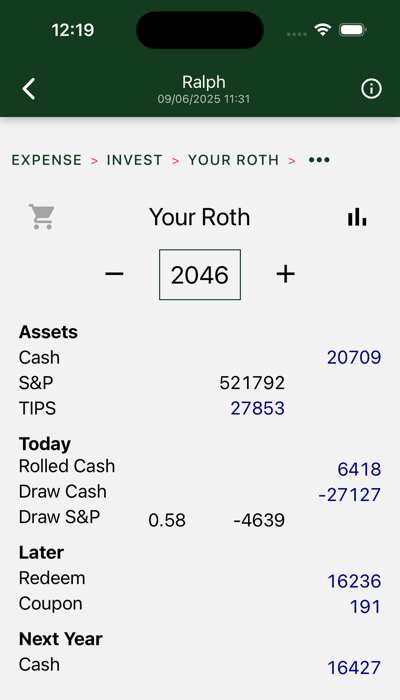
This is one of your Roth accounts.
Shown are 2046 transactions. In this case, we take a cash and S&P rollovers from the IRA and draw cash. Later in the year a bond matures. This deposit will be directed to next year’s payout.
Charts
Three charts are shown. Swipe to view each in turn.
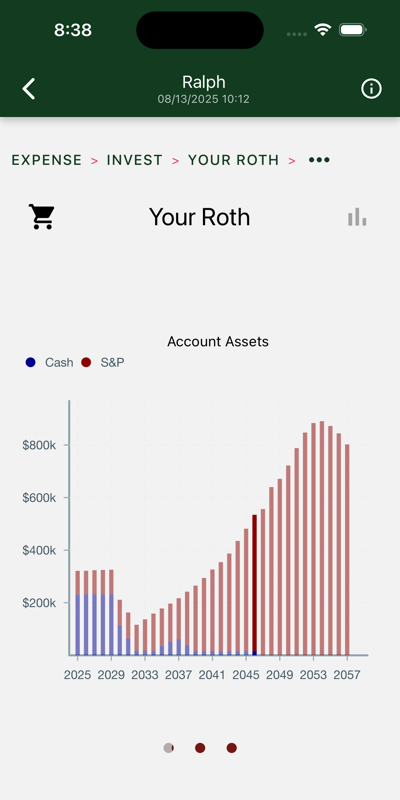
Account Assets
Yearly total account balances, with “cash” and S&P assets highlighted.
In this case, the bulk of the estate migrates to the Roth account as the IRA is drained.
Only after Ralph’s death and the attendant drop in Social Security payments does the balance stop climbing. Your heirs get the remaining $800K tax-free.
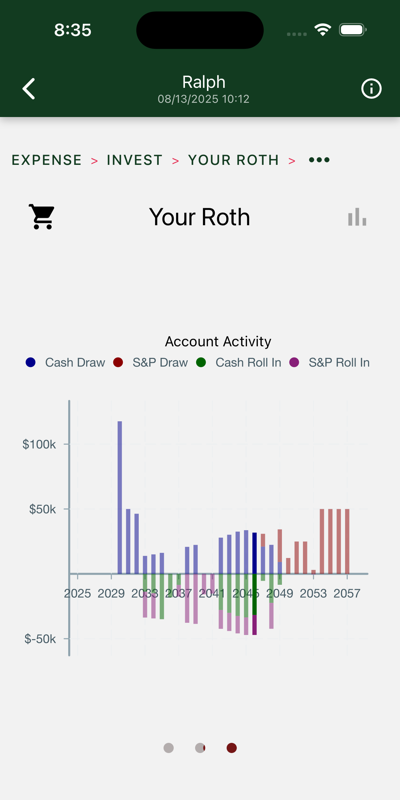
Account Activity
Withdrawals are on top. Roll-ins are on the bottom.
Withdrawals and roll-ins from “cash” and S&P accounts are shown separately.
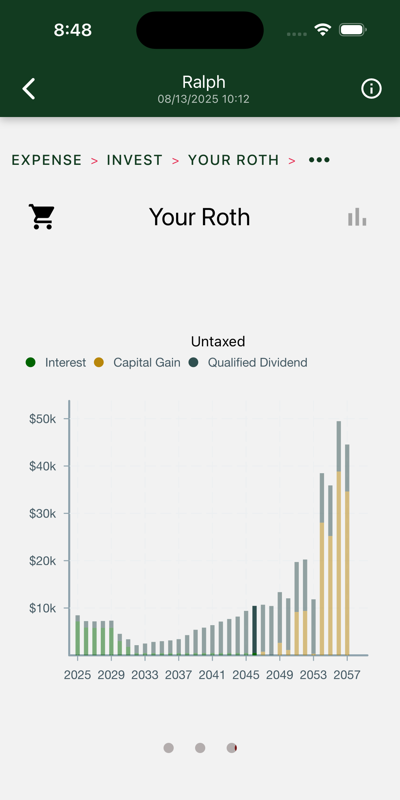
Untaxed Earnings
These numbers are shown solely for amusement purposes.
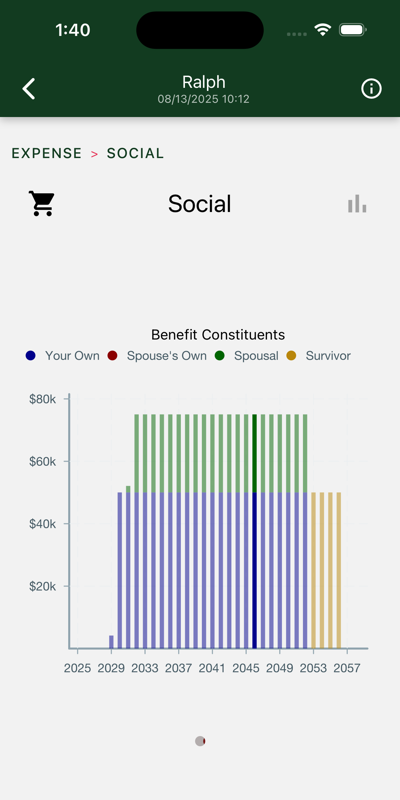
1.2 - Social Security
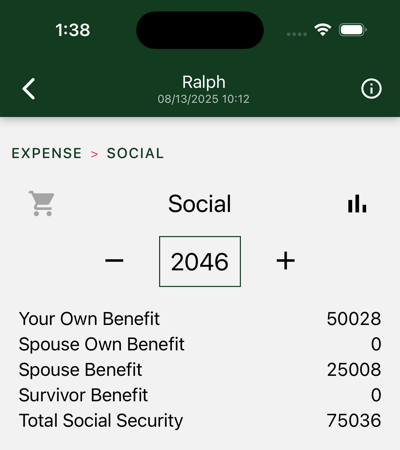
Review Social Security income
Total Social Security payments include:
Your Social Security benefit.
Your spouse’s Social Security benefit.
Spouse benefit, if available.
Survivor benefit, if available.
Social Security is computed from personal data in your profile.
Charts
One chart is shown.
Illustrated is a two-earner couple. Ralph is male and two years older. He maxes out on social security. Margaret is female and hence lives two years longer than Ralph. Her work history was such that she opts for the spousal benefit. Ralph retires at age 64 and commences social security three years later at 67, his full retirement age. Margaret waits two more years before taking the spousal benefit at 67, her FRA. On Ralph’s death, she gets four years of survivor benefits.
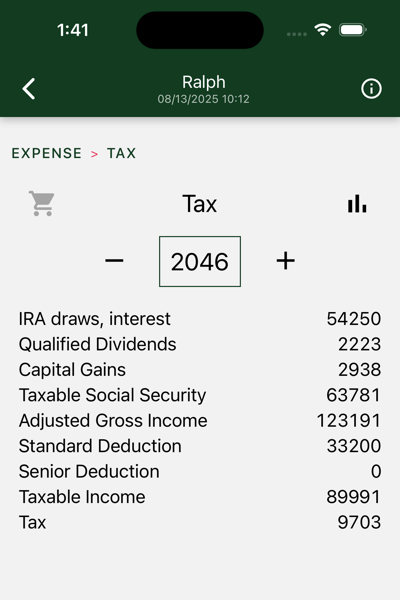
1.3 - Taxes
Yearly constant dollar income tax returns
Hedgematic computes a tax return for each year of your retirement and includes the so-estimated taxes in your draw, over and above your required expenses. Displayed here is an estimated tax return.
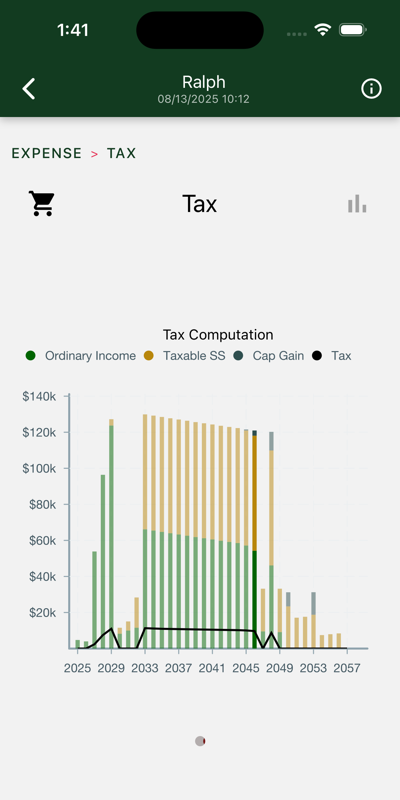
Charts
One chart is displayed.
Tax Computation
Bars represent entries on your 1040.
Ordinary Income includes interest on bonds and withdrawals from your IRA.
Taxable SS is that portion of Social Security subject to income taxes.
Cap Gain includes reinvested (Qualified) S&P Dividends and gains on S&P sales.
The line at the bottom displays your total tax liability.
Note: Check out the smooth descent of the tax inputs in the middle of the chart. What is happening here is that Hedgematic is holding taxable income constant at the top of the 12% bracket. Taxable social security is not indexed for inflation. As it bites more, less room remains for IRA draws, which are consequently steadily decreased. The IRA is being systematically rolled to Roth without ever leaving the 12% bracket. By 2049, the IRA is zeroed out, the taxable social security plummets, and taxes go to zero.
2 - Asset Classess
Account balances are allocated three ways
Your after-tax, IRA, and Roth accounts each contain a mix of the following:
S&P ETF
TIPS Inflation Protected Bonds
Cash
When you are ready to commit to a particular portfolio computation, you find your shopping list for year 0 under each account, with a page for each asset type.
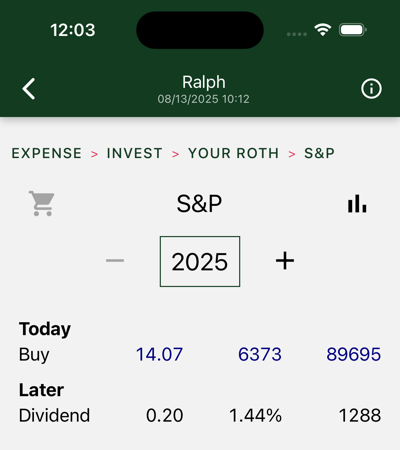
2.1 - S&P
S&P ETF
The S&P 500 is the oldest, most studied index of stock market performance. Hedgematic uses an S&P ETF to capture stock market income and gains. Your brokerage account and any retirement accounts each may have S&P holdings.
Hedgematic tracks S&P holdings in “S&P units”. Each unit is valued at the current S&P average. Your ETF will be priced differently. When you are directed to buy or sell so many units, multiply by the current S&P and divide by the current ETF to get the number of ETF shares to transact.
On day 0, inflation adjusted values and actual dollars are the same. In the first year, as displayed here, you have deployed all Roth assets to S&P.
Following the initial purchase, you are not directed to make any additional purchases, with the exception of reinvested dividends. (there are also in-kind rollovers). In effect, your S&P assets are split into individual tranches, each targeted at a particular year and “held to maturity.”
Hedgematic specifies S&P unit withdrawals for each year. You could just uninstall the app and follow the plan, withdrawing your yearly sums. More likely, you will look to rebalance each year.
The dollar figures shown in future years are estimates denominated in today’s dollars, so you should not expect them to match your future sale proceeds. Your proceeds, if you do back out future inflation, may come out higher or lower than the today’s dollar figures shown, which are modeled estimates. Navigate to the Lessons page to learn how this model is constructed and employed.
There is a chance that these proceeds may not meet your specified after-inflation expenses. You indicated your tolerance for this outcome with the risk aversity you included when you created your profile. But there will be a payday every year. Barring national catastrophe, you will not run out of money.
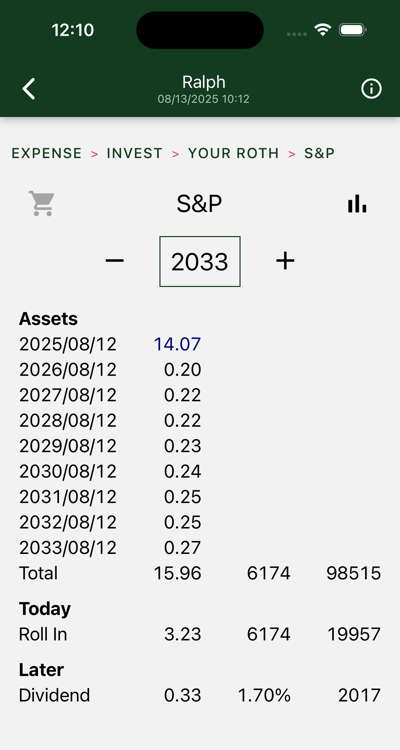
Above is an out-year display.
At the top of the screen, you see you are holding multiple lots of S&P. At the top is your original 14.07 S&Ps. Following you see reinvested dividends for nine years.
In 2033, you are instructed to roll 3.23 S&Ps from your IRA to this Roth.
In later years, you are instructed to sell part or all of particular tranches. Sale proceeds wind up in cash where they are drawn to support your year’s expenses.
Charts
Three charts are shown. Swipe to view each in turn.
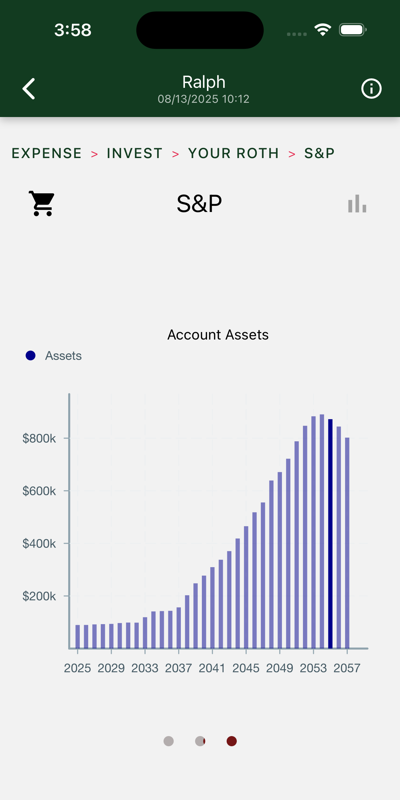
Account Assets
Yearly total account balances.
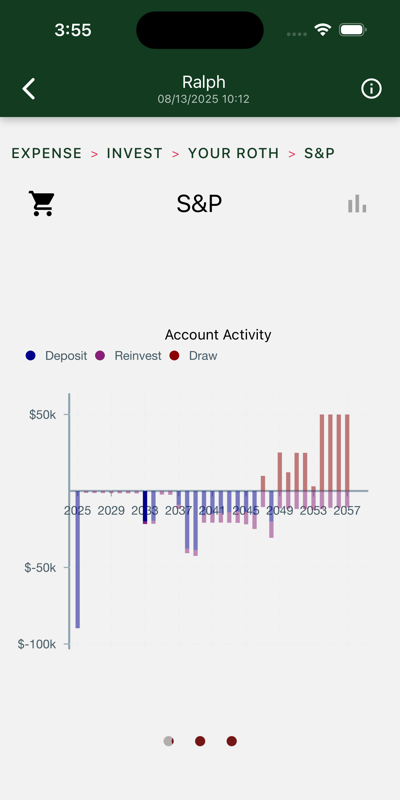
Account Activity
Withdrawals are on top. Initial purchases, reinvestments, and roll-ins are on the bottom.
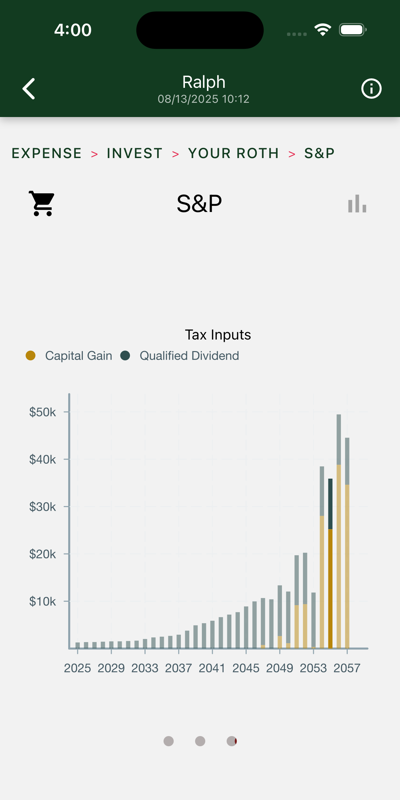
Tax Inputs
If we are in an after-tax account, these figures show up on your tax return. Otherwise, they are tax-free accumulations.
2.2 - TIPS Bonds
TIPS Inflation Protected Bonds
Hedgematic uses TIPS to to hold the inflation/market risk protected portion of your portfolio.
Bonds are purchased on day zero and held to maturity. We are not concerned about intervening volatility, as we are just purchasing a known current dollar sum as of the maturity date. Bond funds that mix maturity dates take on unnecessary market risk.
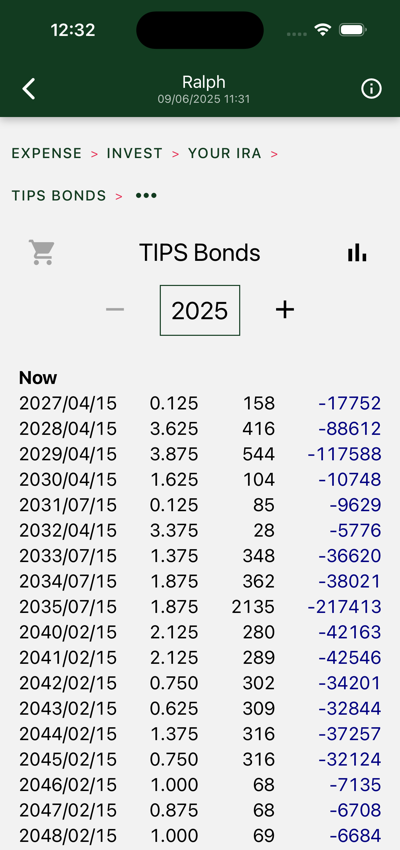
Displayed above is your day zero TIPS shopping list for your IRA account. You see a ladder of bonds,
each of which are redeemed in separate years to give you the guaranteed portion of your yearly expenses. Note that as the term increases, the values decrease. In the out years we can rely more on the typically more profitable S&P to provide more income.
Your broker will list these bonds with treasury bills. The maturity date and coupon yield (in column 2) is used to identify the specific bond.
When issued, these bonds are denominated at $100 “par” value. The third column tells you how many individual bonds you will buy. Many brokers deal only in $1000/ten bond trades. If that is the case, divide the quantities by ten and enter the rounded count in your order.
Since they were issued, their principal value has been contiuously updated for inflation, so you no longer see 158 bonds worth $15800. Your purchase price reflects the additional coupon and redemption value of the bond. This multiplier is called the factor, and is reported along with other bond info.
Bonds will pay coupons twice a year. In after-tax accounts, coupons and an inflation adjustment are reported as income.
Bond income and redemptions are drawn from the account at the end of the year and applied to next year’s expenses.
Figures shown in following years are denominated in today’s dollars, and can be relied on with one exception; the inflation adjustment shown is only an estimate and has an effect only in after-tax accounts.
Drill down to see more information on individual bonds.
Charts
Three charts are shown. Swipe to view each in turn.
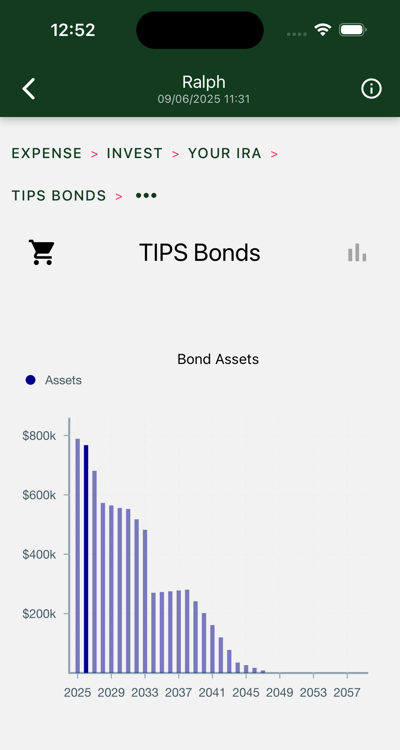
Bond Assets
Total bond value decreases as earlier maturities are redeemed.
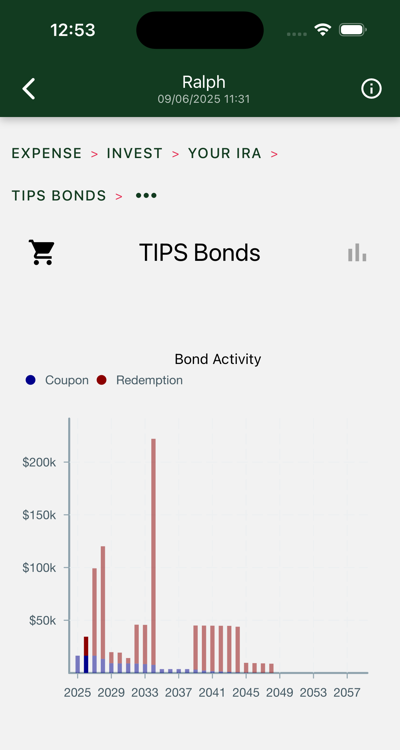
Bond Activity
Tall bars are redemptions. Tiny bars are coupons.
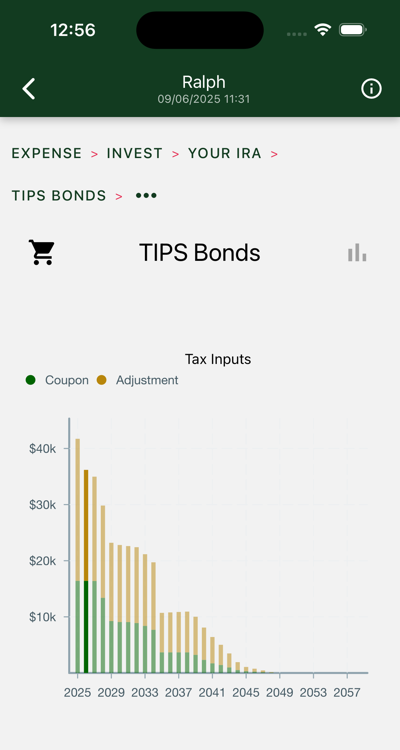
Tax Inputs
If we are in an after-tax account, these figures show up on your tax return. Otherwise, they document tax-free accumulations.
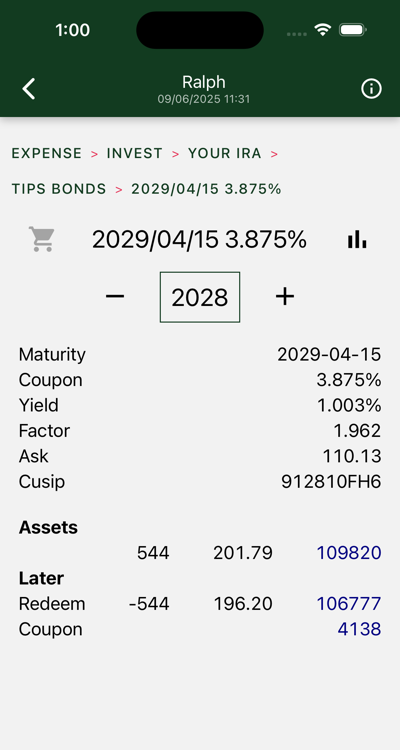
2.2.1 - TIPS Bond
Individual TIPS Inflation Protected Bonds
The information at the top of the page is commonly available when shopping for bonds.
Maturity is the date you get your redemption and last coupon. The redemption amount is computed by multiplying the factor and the number of bonds.
Coupon is paid twice a year. The coupon value is computed by multiplying the coupon rate and the factor and dividing by two. 3.875 * 1.962 / 2 = $3.80 for each bond, twice a year. 544 * $380 * 2 = the $4138 coupon value at the bottom of the page.
Yield is the real yield, in constant dollars. Your bonds will earn both real yield and inflation adjustments.
Factor tells you how much inflation has been added to this bond already. Here, the 1.962 tells you the bond, initially sold for $100, will be redeemed for almost $200 in current dollars, thanks to the power of compound inflation.
The ask is provided you as if the bond was still $100. Multiply ask and factor to get what you will pay for this bond. In this case, it cost $216.07.
The Cusip is an id you can use to search for a particular bond issue.
At the Broker’s
Visit your broker’s Treasury Bonds page. Locate the TIPS bonds.
Each issued bond has a maturity date and a coupon rate. Find the bond that matches the first two columns.
Buy the quantity shown in the third column. This is tricky. The amount you order is not the amount you pay.
These bonds have a “par value” of $100. If you want 158 bonds, you order 158 times $100 or $15800 (depending on broker, likely rounded to the nearest thousand).
The amount you pay, estimated in the fourth column, doesn’t match the order amount, and doesn’t match the figure in the fourth column. Your job is to turn the par value knob, and check whether the displayed cost amount is close.
The actual price of the bond is computed as the Factor times the Ask.
The Factor accounts for the inflation adjustment applied since the bond was issued.
The Ask responds to the Yield, and varies continuously throughout a session.
The amount you pay also includes adjustments to compensate the previous owner for their share of the next coupon.
Your broker will likely offer a ladder builder, where you can enter all the bonds you want first, then buy them in a single transaction.
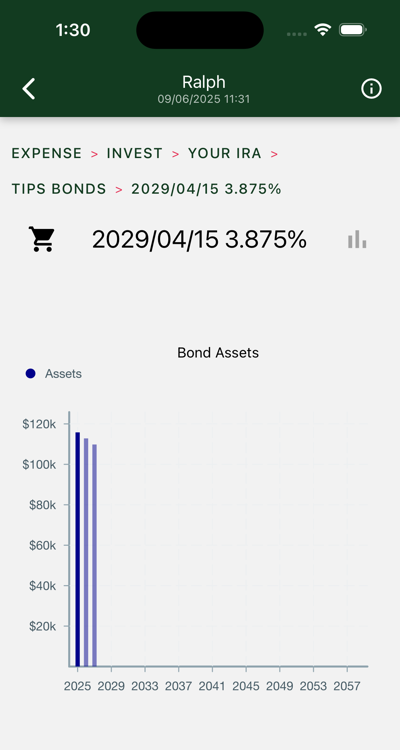
Charts
Three charts are shown. Swipe to view each in turn.
Bond Assets
Present value of bond declines as coupons are paid out.
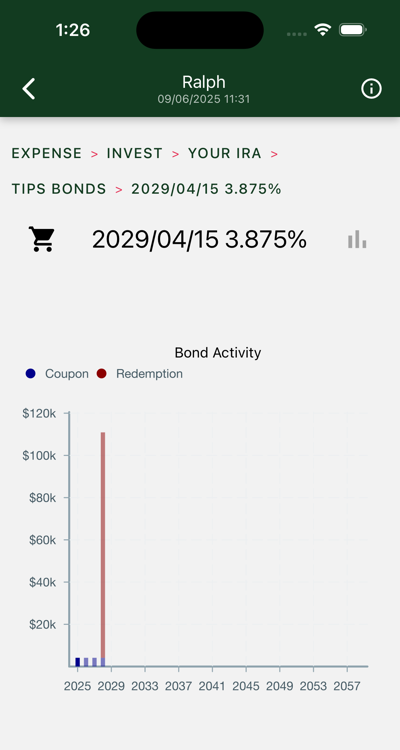
Bond Activity
See small coupons followed by big redemption.
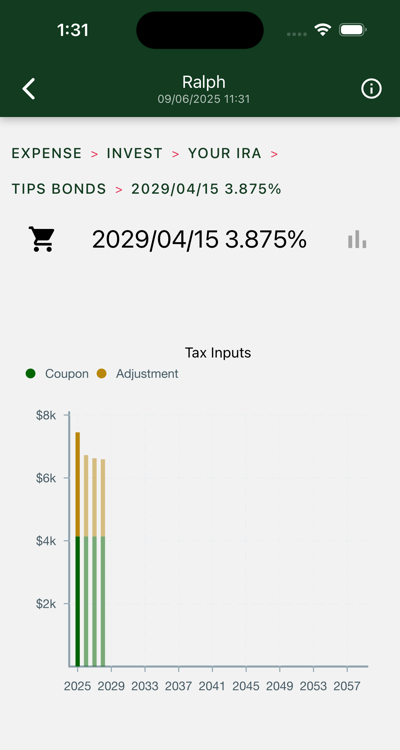
Tax Inputs
The coupons are in today’s dollars. Your adjustments will vary. If the bond is held in a broker account you will have to pay taxes on both coupons and adjustments. These adjustments are estimates from yield curve data of future inflation rates.