This is the multi-page printable view of this section. Click here to print.

Return to the regular view of this page.

Investments

Drill down on investments

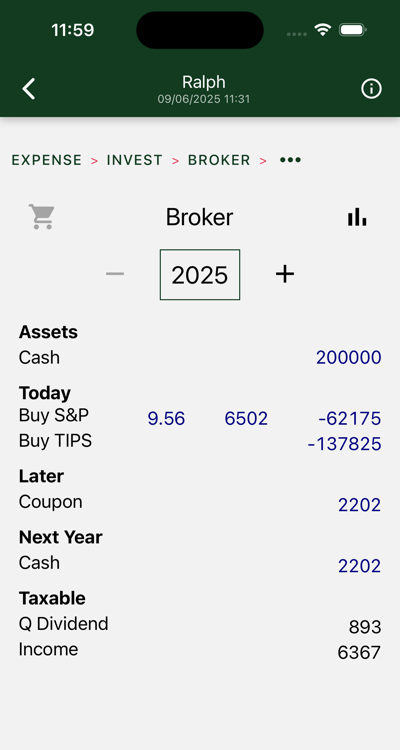
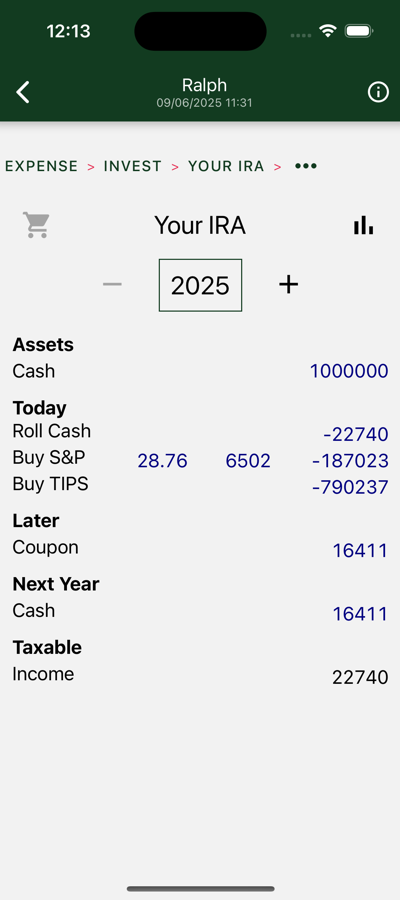
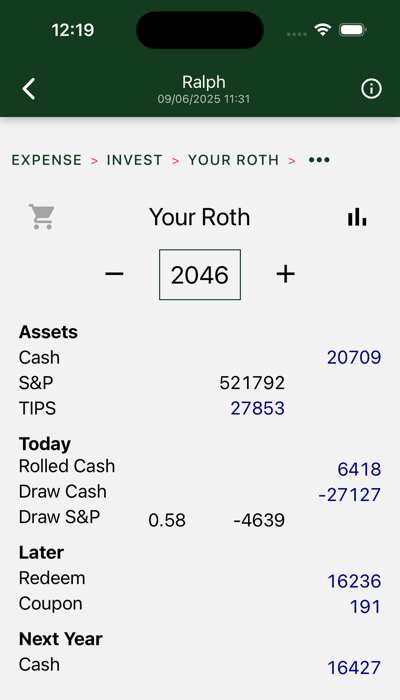
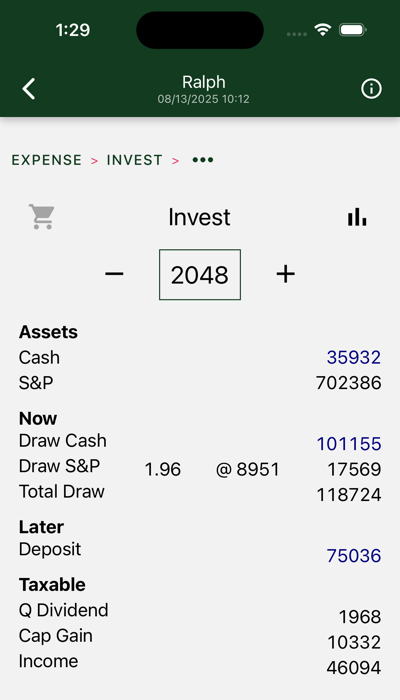
Your assets are divided between after-tax and retirement accounts. Within each account, assets may be held in “cash,” including inflation-protected bonds, or S&P index instruments.

In this year, we draw cash and S&P. Cash draws are denominated in current dollars. The blue font is used to distinguish actual current dollar figures from modeled estimates of market performance. The S&P withdrawal is denominated in S&P units, or multiples of the S&P average (predicted to be $8951 in 2048). It will vary depending on market performance. Note that, given current valuations, we are depending on the market for only 15% of our 2048 income.

The draw includes $110K of after-tax expenses and an estimated $8724 tax payment.

Figures at the bottom show tax inputs from your before-tax account and traditional IRA(s).

Charts

Four charts are shown. Swipe to view each in turn.

Drill down further in results to see similar charts for each separate account. Charts on this page show totals across all of your accounts.
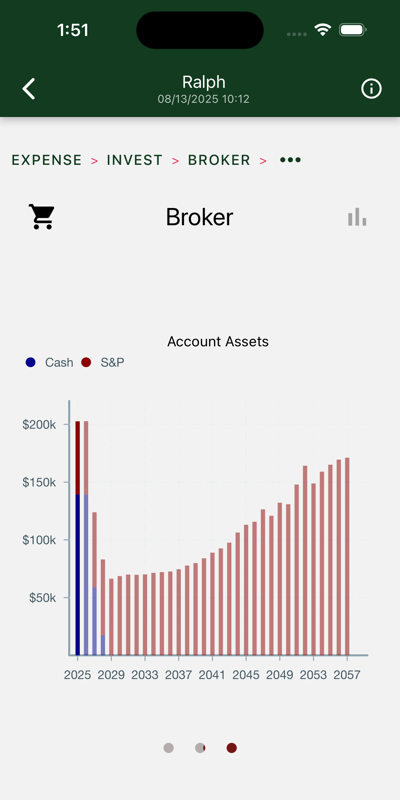
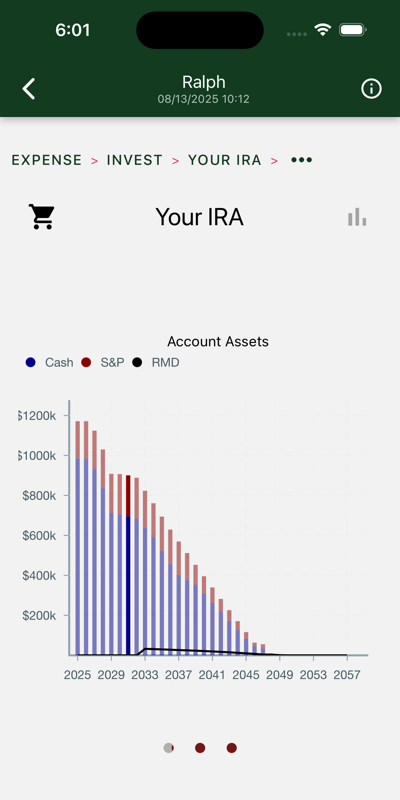
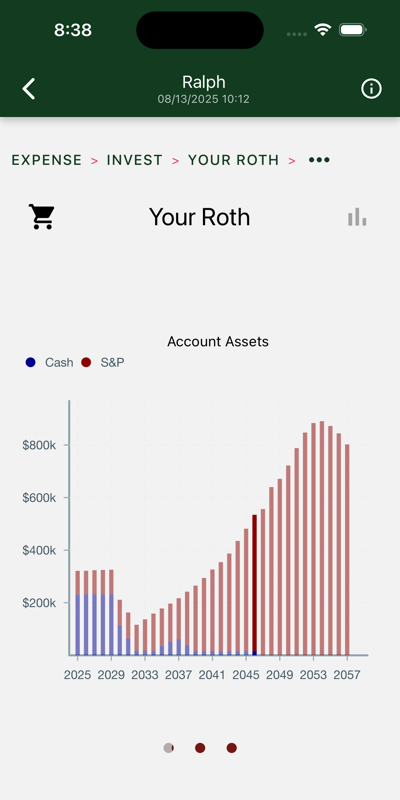
Assets

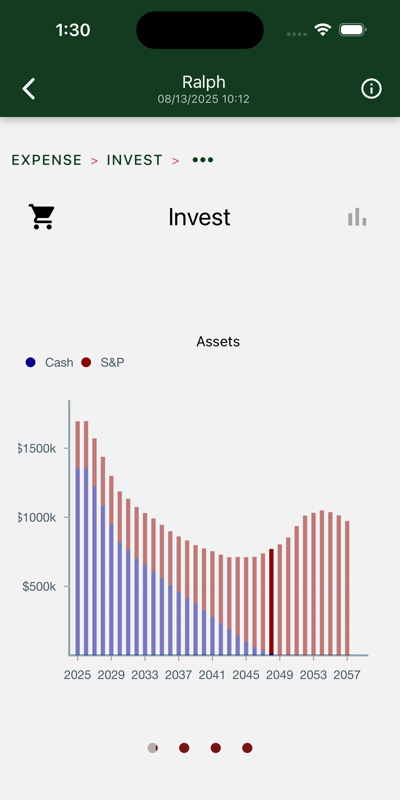
Yearly total account balances, with “cash” and S&P assets highlighted. Cash assets are reserved for the early years, when stock market volatility poses the greatest risk and you don’t have social security to anchor your hedge.
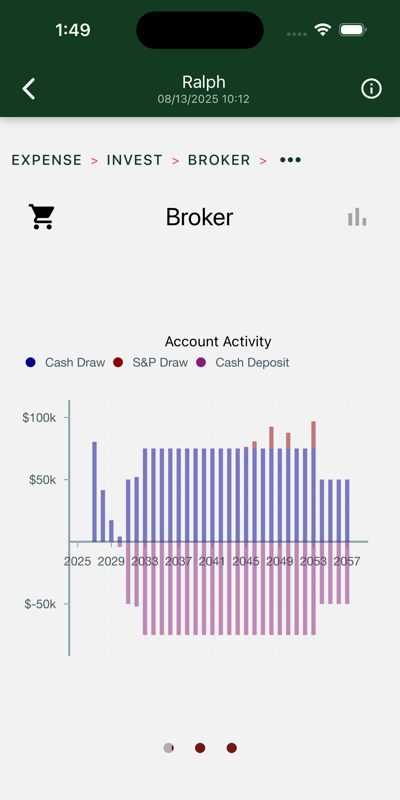
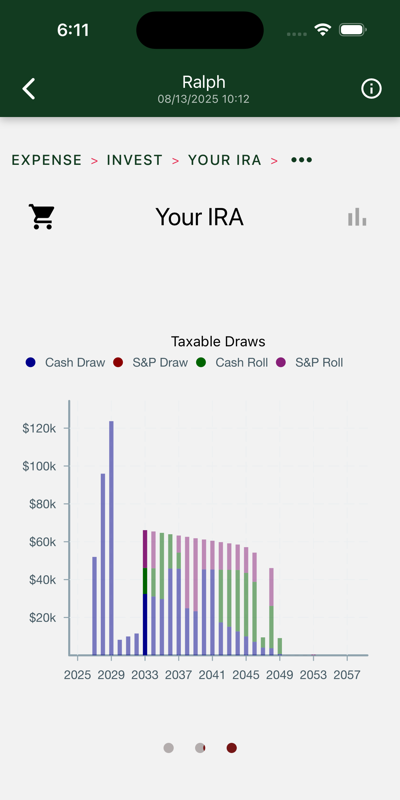
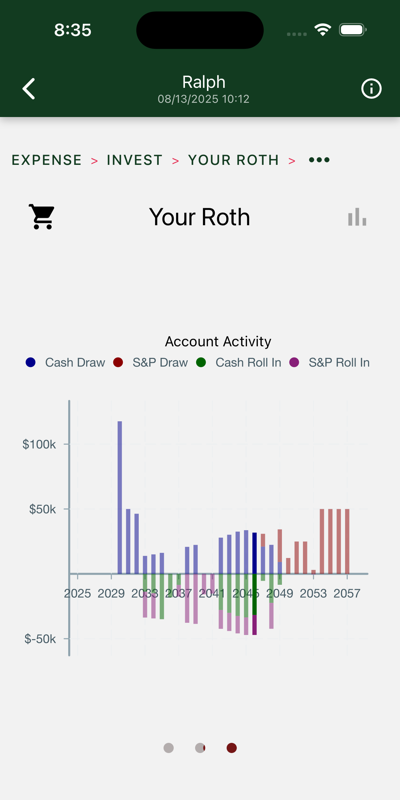
Source of draws

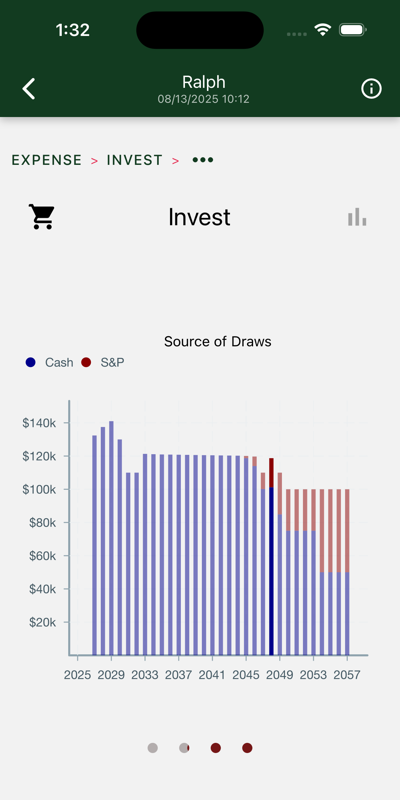
Withdrawals from your investment accounts. Cash assets are consumed first, until the higher expected returns of the stock market catch up to and overtake their expected risk.

Required cash percentage

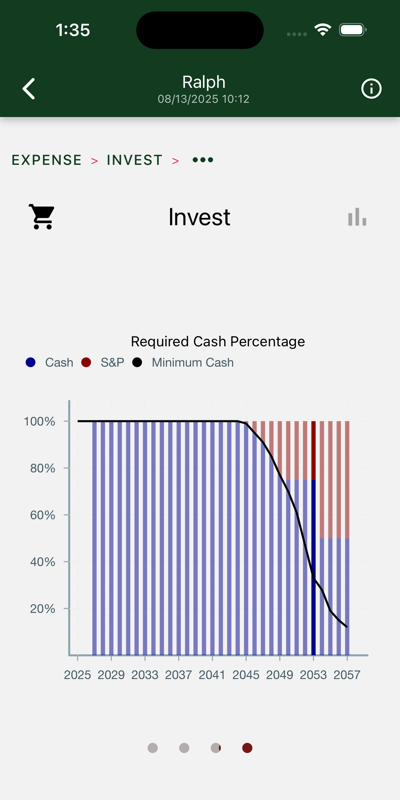
The bars show the percentage of cash assets in each year’s draw. The line shows the required percentage. The bars and line diverge when social security is suffiecient to cover the cash portion of your hedge.

These percentages vary greatly depending on a ten-year moving average of market valuations. The 2023 version of this chart has you all in on stock by 2043.
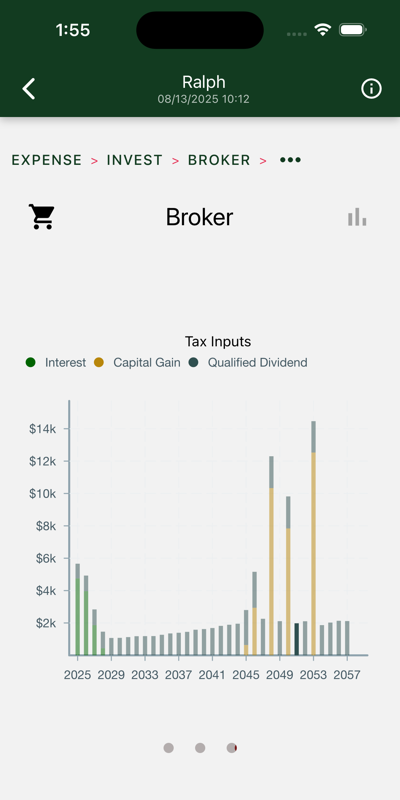
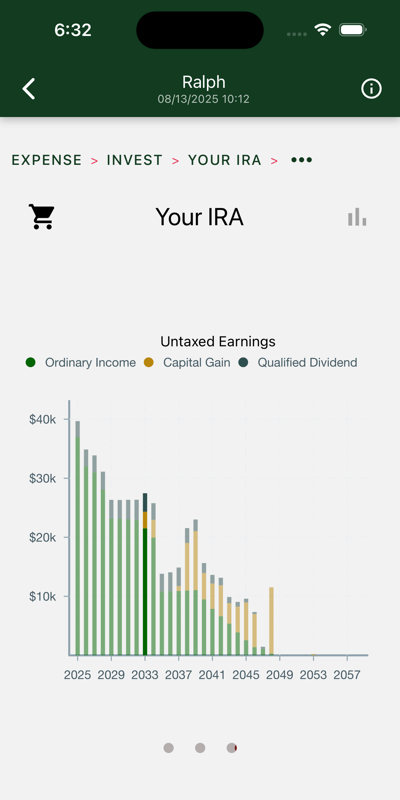
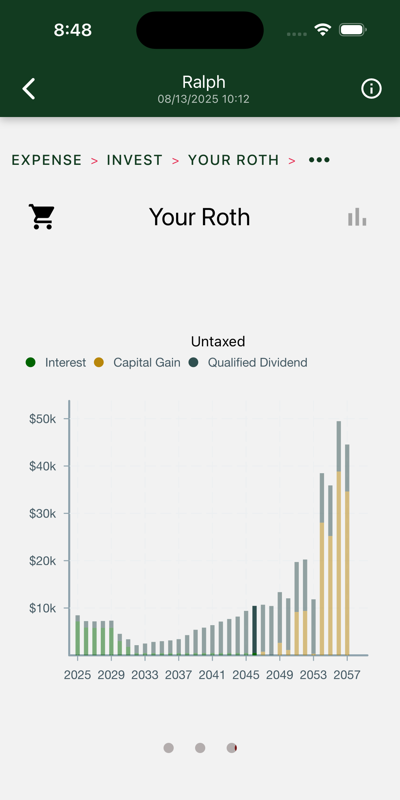
Tax inputs

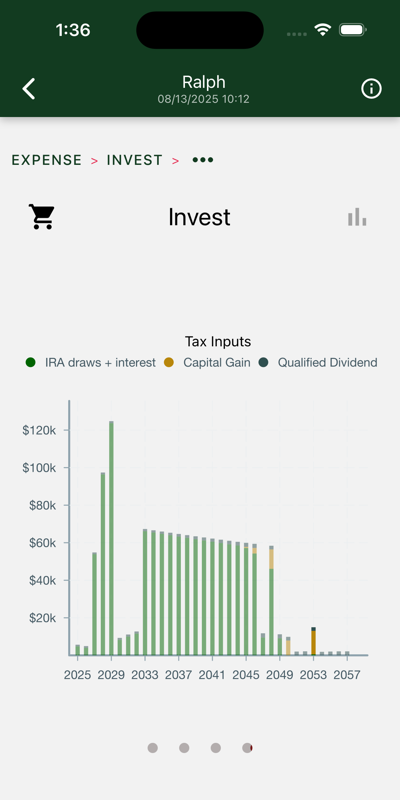
These numbers are entered on your tax return. They come from two sources:

  • After tax account:
    • Ordinary income from bond interest.
    • Imputed ordinary income from bond inflation adjustments
    • Qualified dividends from S&P ETFs. These are reinvested.
    • Capital gain on S&P draws.
  • Traditional IRAs
    • Withdrawals are taxed as ordinary income.
    • Rollovers to Roth accounts are also treated as ordinary income.

In this case, IRA draws are the biggest contributor.

1 - Broker

After-tax account

This is your “broker” or after-tax account.

Required actions are shown for each year. Drill down to see details. The illustration shows the transactions used to set up the portfolio in the first year, in this case, an S&P purchase, and a ladder of TIPS bonds that mature over the first years of the portfolio.

Bond and social security income accrues over the remainder of the year. It is carried over to the next year, where it is typically pulled with the cash draw. (On those occasions where it is not, inflation is charged.)

Charts

Three charts are shown. Swipe to view each in turn.

Account Assets

Yearly total account balances, with “cash” and S&P assets highlighted.

Here we see we took our cash and bought some bonds and S&P. The bonds are gone pretty quick. The stock is held to the last years of retirement, when the IRA is gone and the capital gains can be drawn tax free. $150K goes to heirs.

Account Activity

In this chart, we see an initial set of withdrawals used to support us for the first three years. On the right side of the chart we mostly see social security deposits being deposited, then withdrawn to support the succeeding year.

Tax inputs

These numbers are entered on your tax return.

We can see:

  • Bond coupons in the first couple years.
  • S&P dividends over remaining years.
  • Capital gains as S&P portion is tapped.

2 - IRA

IRA balances and transactions

This is the first year of one of your IRA accounts.

Here we see your assets deployed to ensure a steady stream of payments throughout your retirement. Of the starting balance, a big chunk goes to S&P. The remainder goes to build a ladder of TIPS bonds. These will drop a tranche of cash every year sufficient to anchor the cash leg of your hedged payment.

In later years, listed transactions might include:

  • Cash draws
  • S&P draws
  • Cash rollovers to Roth
  • S&P rollovers to Roth

Charts

Three charts are shown. Swipe to view each in turn.

Account Assets

Yearly total account balances, with cash and S&P assets highlighted. The black line shows your required minimum distribution, or RMD.

Here we see we took our starting balance and bought some bonds and S&P. The bonds are exhausted in a few years. The total balance trends down under pressure from yearly draws and Roth roll-overs. By 2048 most of your assets are in your broker or Roth account.

Taxable Draws

Withdrawals from your IRA account. These numbers are taxed as ordinary income. There are two ways to draw from an IRA:

  • A regular distribution is included in your expenses for the year.
  • IRA assets can also be “rolled over” to your Roth account. Pay your taxes on the withdrawal when you roll over, and later withdraw them tax-free from the Roth account. Hedgematic uses this strategy to smooth your tax rates over the entire course of your retirement.

Withdrawals and rollovers from cash and S&P are shown separately.

Untaxed Earnings

These numbers are for information only and not entered on your tax return. Regretably, they all show up as ordinary income when they are eventually drawn or rolled.

We can see:

  • Bond coupons in the first couple years.
  • Diminishing S&P dividends as the position shrinks.
  • Capital gains as S&P portion is rolled.

3 - Roth

Roth account balances and transactions

This is one of your Roth accounts.

Shown are 2046 transactions. In this case, we take a cash and S&P rollovers from the IRA and draw cash. Later in the year a bond matures. This deposit will be directed to next year’s payout.

Charts

Three charts are shown. Swipe to view each in turn.

Account Assets

Yearly total account balances, with “cash” and S&P assets highlighted.

In this case, the bulk of the estate migrates to the Roth account as the IRA is drained.

Only after Ralph’s death and the attendant drop in Social Security payments does the balance stop climbing. Your heirs get the remaining $800K tax-free.

Account Activity

Withdrawals are on top. Roll-ins are on the bottom.

Withdrawals and roll-ins from “cash” and S&P accounts are shown separately.

Untaxed Earnings

These numbers are shown solely for amusement purposes.