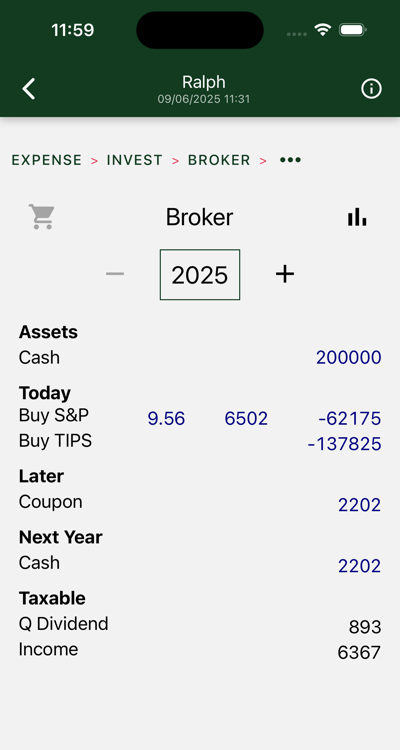
This is your “broker” or after-tax account.
Required actions are shown for each year. Drill down to see details. The illustration shows the transactions used to set up the portfolio in the first year, in this case, an S&P purchase, and a ladder of TIPS bonds that mature over the first years of the portfolio.
Bond and social security income accrues over the remainder of the year. It is carried over to the next year, where it is typically pulled with the cash draw. (On those occasions where it is not, inflation is charged.)
Charts
Three charts are shown. Swipe to view each in turn.
Account Assets
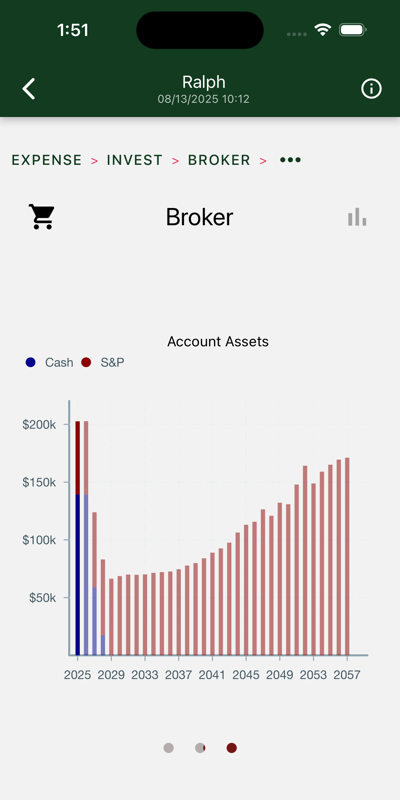
Yearly total account balances, with “cash” and S&P assets highlighted.
Here we see we took our cash and bought some bonds and S&P. The bonds are gone pretty quick. The stock is held to the last years of retirement, when the IRA is gone and the capital gains can be drawn tax free. $150K goes to heirs.
Account Activity
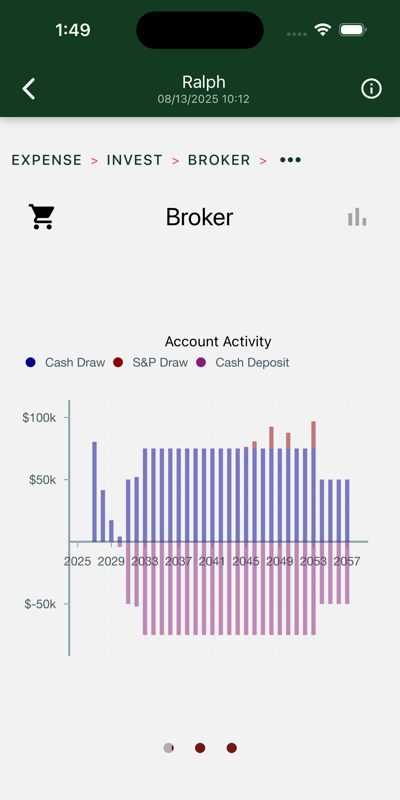
In this chart, we see an initial set of withdrawals used to support us for the first three years. On the right side of the chart we mostly see social security deposits being deposited, then withdrawn to support the succeeding year.
Tax inputs
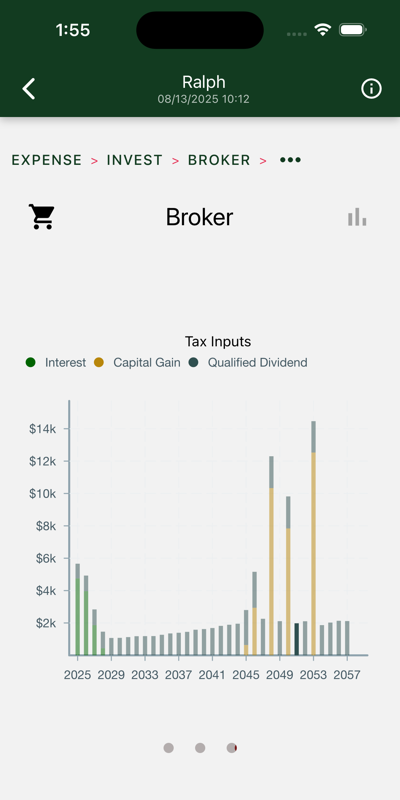
These numbers are entered on your tax return.
We can see:
- Bond coupons in the first couple years.
- S&P dividends over remaining years.
- Capital gains as S&P portion is tapped.