Investments
Drill down on investments
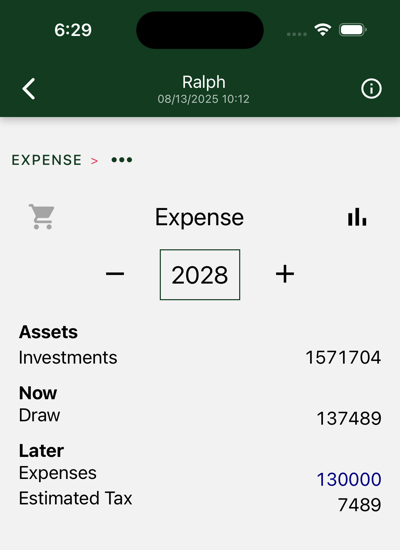
This is the first result screen you will see. Did you make your expenses. Are you over? Where are you short?
This, and succeeding screens, share navigation features.
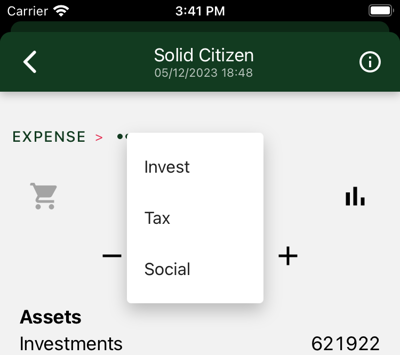
The breadcrumb at the top of the page lets you drill down on result details and pop back up. Tap the dots to select drill-down options. Here we have Investment, Tax, and Social.
The back arrow returns you to the result list. Return to the top level by tapping EXPENSE in the breadcrumb.
Tap the chart icon to see charts for each level.
Usually, multiple charts are available. Swipe to view each in turn.
Tap inside the chart to change the cart view display year.
Tap the cart view icon to switch back to cart view.
At this level three charts are available.
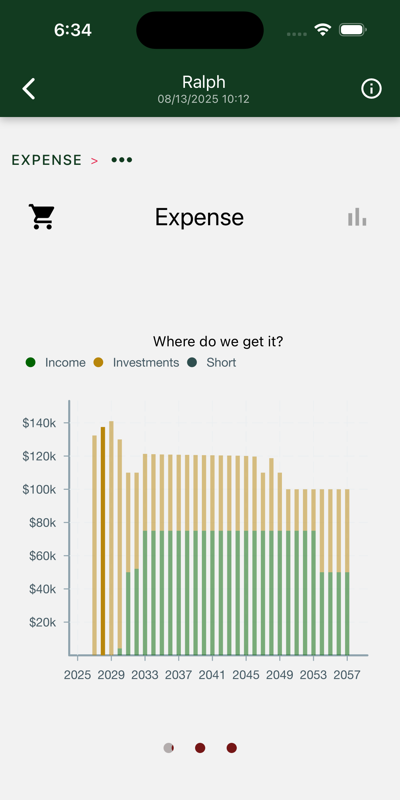
Data is displayed for the duration of your retirement. In this case we see retirement starts in two years.
Bars represent the actual payments from investments or cash income and, if applicable, any shortfall between that income and your required expenses. Cover the shortfalls and you are ready to commence retirement.
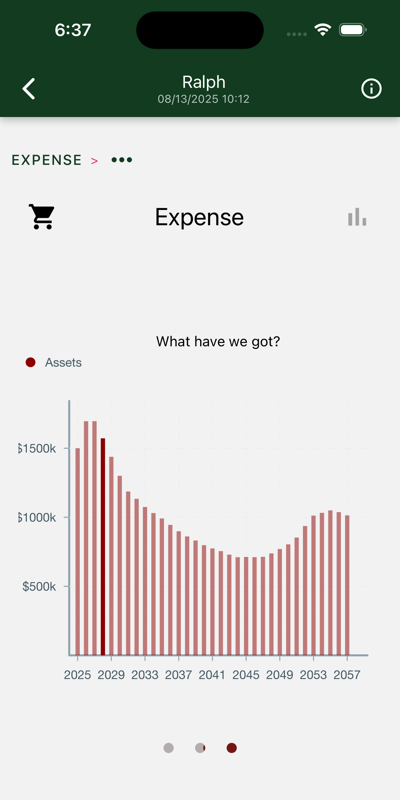
Shows total balance over years in your investment accounts. In this case we see assets diminishing until Social Security really kicks in. After many comfortable years, Ralph dies, and the Mrs., on reduced payments, starts to draw down the balance, eventually leaving a million to her heirs.
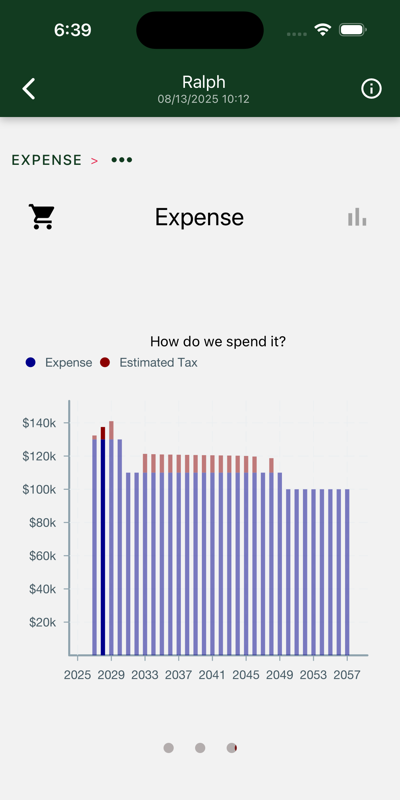
Your expenses are your desired current-dollar, after-tax expenses, plus estimated taxes you need to pay. Note that you never paid more than $11K in taxes.
Drill down on investments
Review Social Security income
Yearly constant dollar income tax returns