Broker
After-tax account
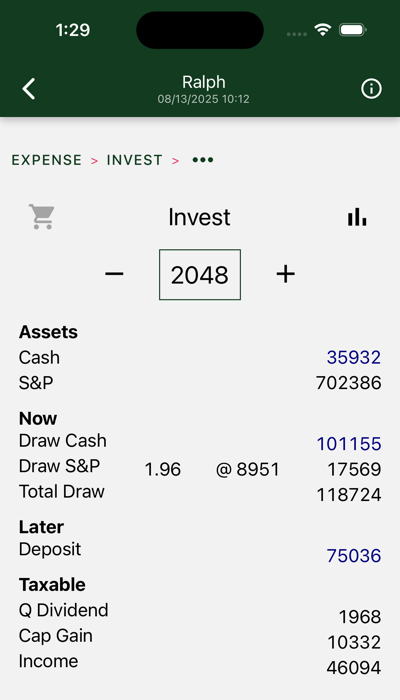
Your assets are divided between after-tax and retirement accounts. Within each account, assets may be held in “cash,” including inflation-protected bonds, or S&P index instruments.
In this year, we draw cash and S&P. Cash draws are denominated in current dollars. The blue font is used to distinguish actual current dollar figures from modeled estimates of market performance. The S&P withdrawal is denominated in S&P units, or multiples of the S&P average (predicted to be $8951 in 2048). It will vary depending on market performance. Note that, given current valuations, we are depending on the market for only 15% of our 2048 income.
The draw includes $110K of after-tax expenses and an estimated $8724 tax payment.
Figures at the bottom show tax inputs from your before-tax account and traditional IRA(s).
Four charts are shown. Swipe to view each in turn.
Drill down further in results to see similar charts for each separate account. Charts on this page show totals across all of your accounts.
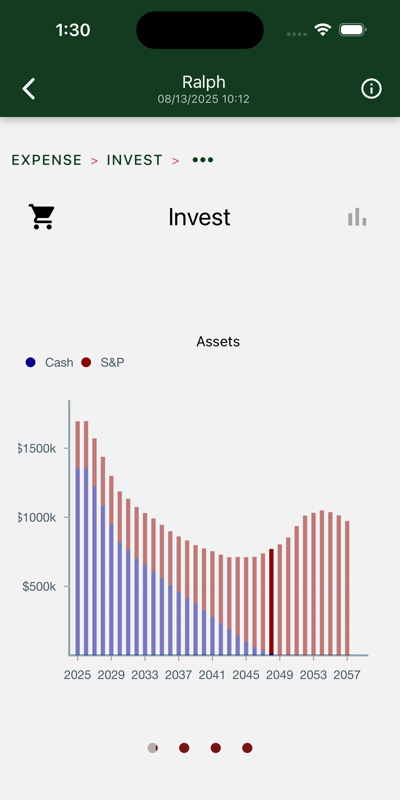
Yearly total account balances, with “cash” and S&P assets highlighted. Cash assets are reserved for the early years, when stock market volatility poses the greatest risk and you don’t have social security to anchor your hedge.
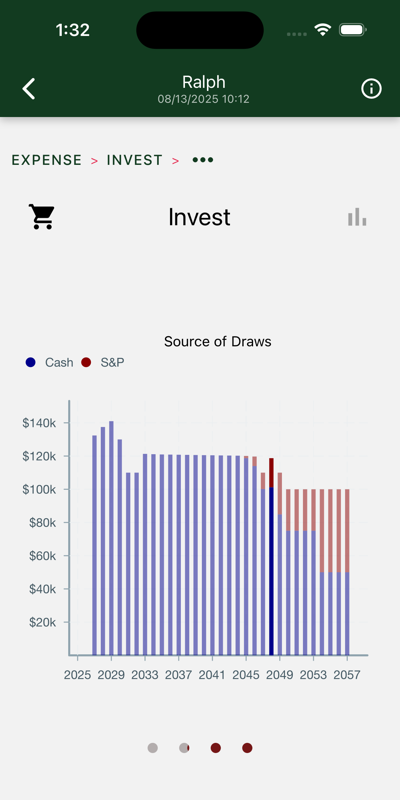
Withdrawals from your investment accounts. Cash assets are consumed first, until the higher expected returns of the stock market catch up to and overtake their expected risk.
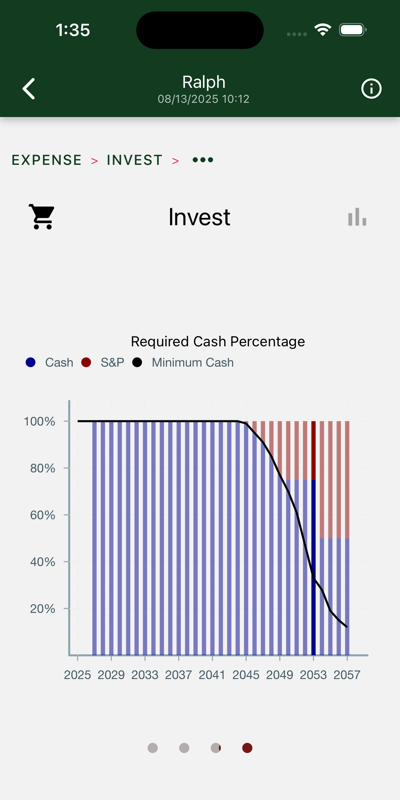
The bars show the percentage of cash assets in each year’s draw. The line shows the required percentage. The bars and line diverge when social security is suffiecient to cover the cash portion of your hedge.
These percentages vary greatly depending on a ten-year moving average of market valuations. The 2023 version of this chart has you all in on stock by 2043.
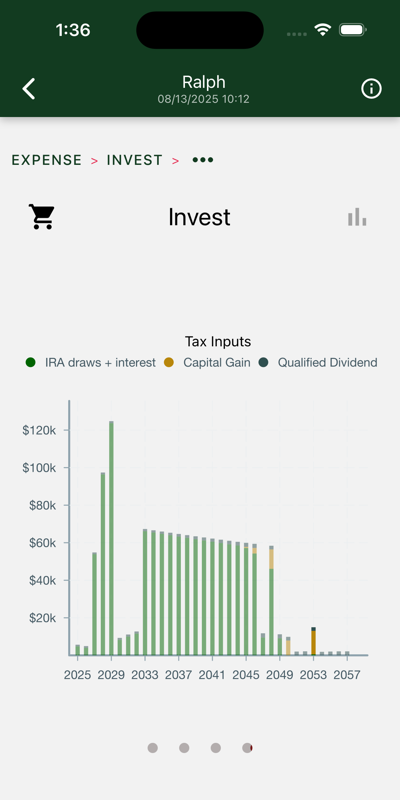
These numbers are entered on your tax return. They come from two sources:
In this case, IRA draws are the biggest contributor.